Understanding statistical significance
Customer Analytics and A/B Testing in Python

Ryan Grossman
Data Scientist, EDO
Revisiting statistical significance
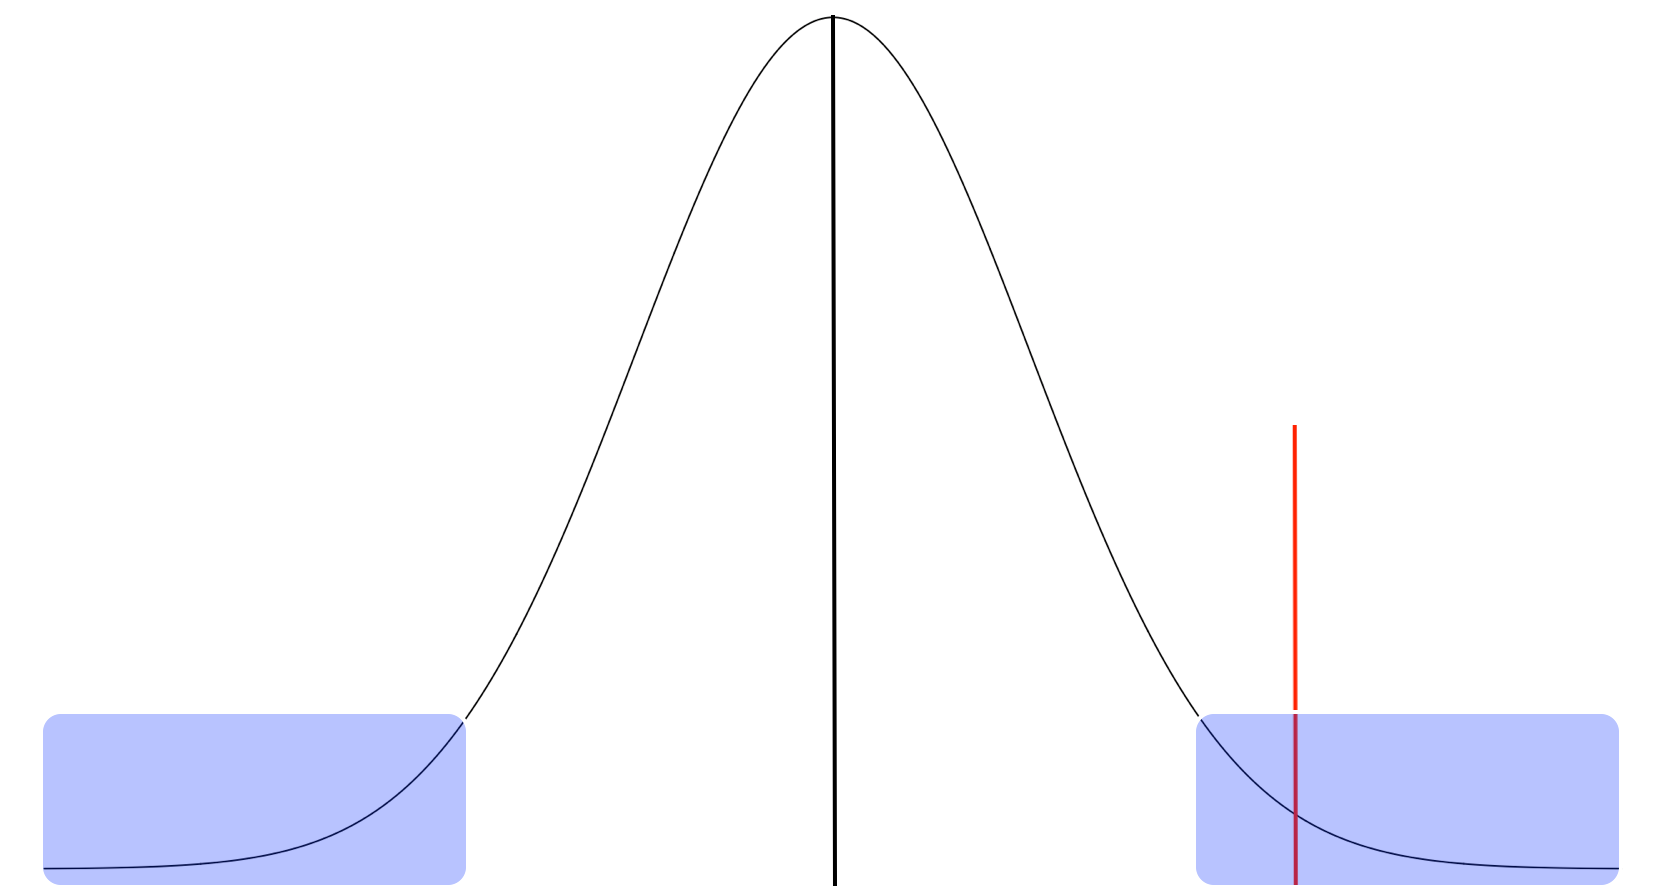
- Distribution of expected difference between control and test groups _if_ the Null Hypothesis true
- Red line: The observed difference in conversion rates from our test
- p-value: Probability of being as or more extreme than the red line on either side of the distribution
p-value Function
# calculate the p-value from our
# group conversion rates and  group sizes
def get_pvalue(con_conv, test_conv,con_size,  test_size,):
    lift =  - abs(test_conv - con_conv)
    scale_one = con_conv * (1 - con_conv) * (1 / con_size)
    scale_two = test_conv * (1 - test_conv) * (1 / test_size)
    scale_val = (scale_one + scale_two)**0.5
    p_value = 2 * stats.norm.cdf(lift, loc = 0, scale = scale_val )

    return p_value
Calculating our p-value
- Observe a small p-value and statistically significant results
- Achieved lift is relatively large
# previously calculated quantities con_conv = 0.034351 # control group conversion rate test_conv = 0.041984 # test group conversion rate con_size = 48236 # control group size test_size = 49867 # test group size# calculate the test p-value p_value = get_pvalue(_conv, con_size, test_size) print(p_value)
4.2572974855869089e-10
Finding the power of our test
# Calculate our test's power
get_power(test_size, con_conv, test_conv, 0.95)
0.99999259413722819
What is a confidence interval
- Range of values for our estimation rather than single number
- Provides context for our estimation process
- Series of repeated experiments...
- the calculated intervals will contain the true parameter X% of the time
- The true conversion rate is a fixed quantity, our estimation and the interval are variable
Confidence interval calculation
Confidence Interval Formula $$\mu \pm \Phi\left(\alpha + \frac{1 - \alpha}{2}\right) \times \sigma$$
- Estimated parameter (difference in conversion rates) follows Normal Distribution
- Can estimate the:
- standard deviation ($\sigma$) and...
- mean ($\mu$) of this distribution
- $\alpha$: Desired confidence interval width
- Bounds containing X% of the probability around the mean (e.g. 95%) of that distribution
Confidence interval function
# Calculate the confidence interval
from scipy import stats
def get_ci(test_conv, con_conv,
    test_size, con_size, ci):

    sd = ((test_conv * (1 - test_conv)) / test_size +
        (con_conv * (1 - con_conv)) / con_size)**0.5
    lift = test_conv - con_conv

    val = stats.norm.isf((1 - ci) / 2)
    lwr_bnd = lift - val * sd
      upr_bnd = lift + val * sd

    return((lwr_bnd, upr_bnd))
Calculating confidence intervals
test_conv: test group conversion ratecon_conv: control group conversion ratetest_size: test group observationscon_size: control group observations
# Calcualte the conversion rate
get_ci(
    test_conv, con_conv,
    test_size, con_size,
    0.95
)
(0.00523, 0.0100)
- Provides additional context about our results
Next steps
- Adding context to our test results
- Communicating the data through visualizations
Let's practice!
Customer Analytics and A/B Testing in Python

