Analyzing the A/B test results

Customer Analytics and A/B Testing in Python

Ryan Grossman

Data Scientist, EDO

Analyzing A/B test results

  • How to analyze an A/B test
  • Further topics in A/B testing

Customer Analytics and A/B Testing in Python

Evaluating our paywall test

  • So far: Run our test for the specified amount of time
  • Next: Compare the two groups' purchase rates

Customer Analytics and A/B Testing in Python

Test results data

# Demographic information for our test groups
test_demographics = pd.read_csv('test_demographics.csv`)

# results for our A/B test # group column: 'c' for control | 'v' for variant test_results = pd.read_csv('ab_test_results.csv')
test_results.head(n=5)
        uid        date  purchase  sku  price group
0  90554036  2018-02-27         0  NaN    NaN     C
1  90554036  2018-02-28         0  NaN    NaN     C
2  90554036  2018-03-01         0  NaN    NaN     C
3  90554036  2018-03-02         0  NaN    NaN     C
4  90554036  2018-03-03         0  NaN    NaN     C
Customer Analytics and A/B Testing in Python

Confirming our test results

  • Crucial to validate your test data
    • Does the data look reasonable?
    • Ensure you have a random sample

Customer Analytics and A/B Testing in Python

Are our groups the same size?

# Group our data by test vs. control
test_results_grpd = test_results.groupby(
    by=['group'], as_index=False)

# Count the unique users in each group test_results_grpd.uid.count()
    group     uid
0     C        48236
1     V        49867
Customer Analytics and A/B Testing in Python

Do our groups have similar demographics?

# Group our test data by demographic breakout
test_results_demo = test_results.merge(
    test_demo, how='inner', on='uid')
test_results_grpd = test_results_demo.groupby(
    by= ['country','gender', 'device', 'group' ],
    as_index=False)
test_results_grpd.uid.count()
country    gender    device    group    uid
BRA        F        and        C        5070
BRA        F        and        V        4136
BRA        F        iOS        C        3359
BRA        F        iOS        V        2817
...
Customer Analytics and A/B Testing in Python

Test & control group conversion rates

# Find the count of payawall viewer and purchases in each group
test_results_summary = test_results_demo.groupby(
    by=['group'], as_index=False
).agg({'purchase': ['count', 'sum']})

# Calculate our paywall conversion rate by group test_results_summary['conv'] = (test_results_summary.purchase['sum'] / test_results_summary.purchase['count']) test_results_summary
                group  purchase      conv
count     sum 
    0       C   48236      1657  0.034351
    1       V   49867      2094  0.041984
Customer Analytics and A/B Testing in Python

Is the result statistically significant?

  • Statistical Significance: Are the conversion rates different enough?
    • If yes then we reject the null hypothesis
    • Conclude that the paywall's have different effects
    • If _no_ then it may just be randomness
Customer Analytics and A/B Testing in Python

p-values

  • probability if the Null Hypothesis is true...
  • of observing a value as or more extreme...
  • than the one we observed

  • Low p-values

    • represent potentially significant results
    • the observation is unlikely to have happened due to randomness
Customer Analytics and A/B Testing in Python

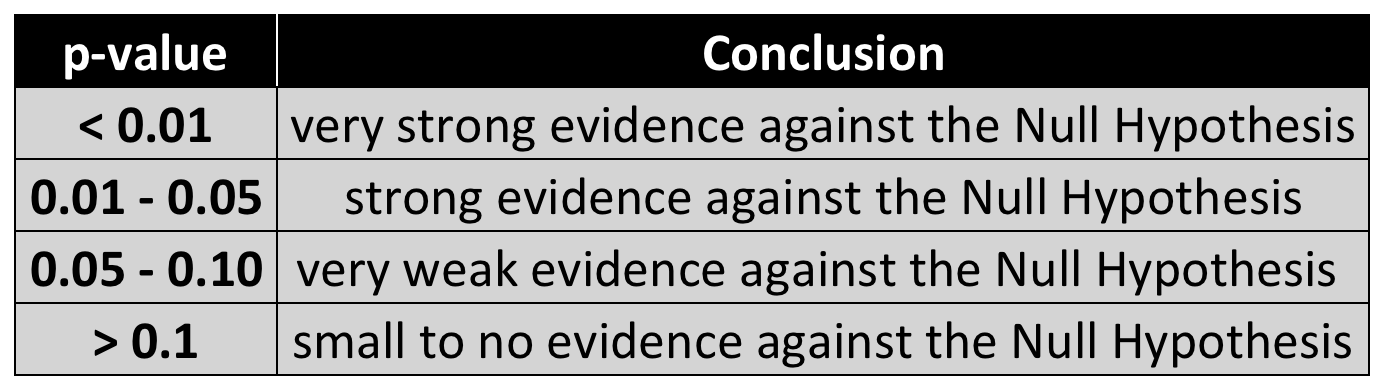
Interpreting p-values

  • Controversial concept in some ways
  • Typically: accept or reject hypothesis based on the p-value
  • Below table shows the general rules of thumb:

alt

Customer Analytics and A/B Testing in Python

Next steps

  1. Confirm our results
  2. Explore how to provide useful context for them

Customer Analytics and A/B Testing in Python

Let's practice!

Customer Analytics and A/B Testing in Python

Preparing Video For Download...