Understanding and visualizing trends in customer data
Customer Analytics and A/B Testing in Python

Ryan Grossman
Data Scientist, EDO
Further techniques for uncovering trends
Weekly seasonality and our pricing change
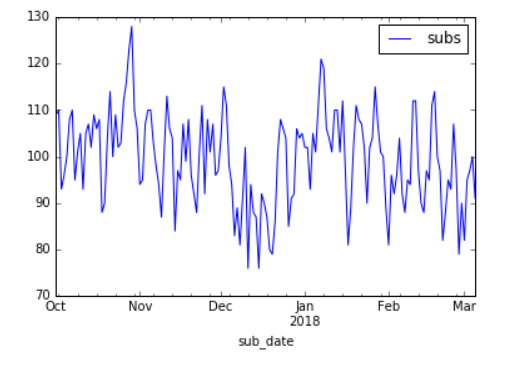
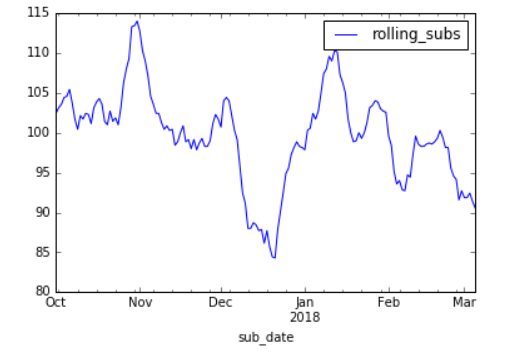
Smoothing our USA subscription data
.rollinglikegroupbyspecifies a grouping of data points- We still need to calculate a summary over this group (e.g.
.mean())
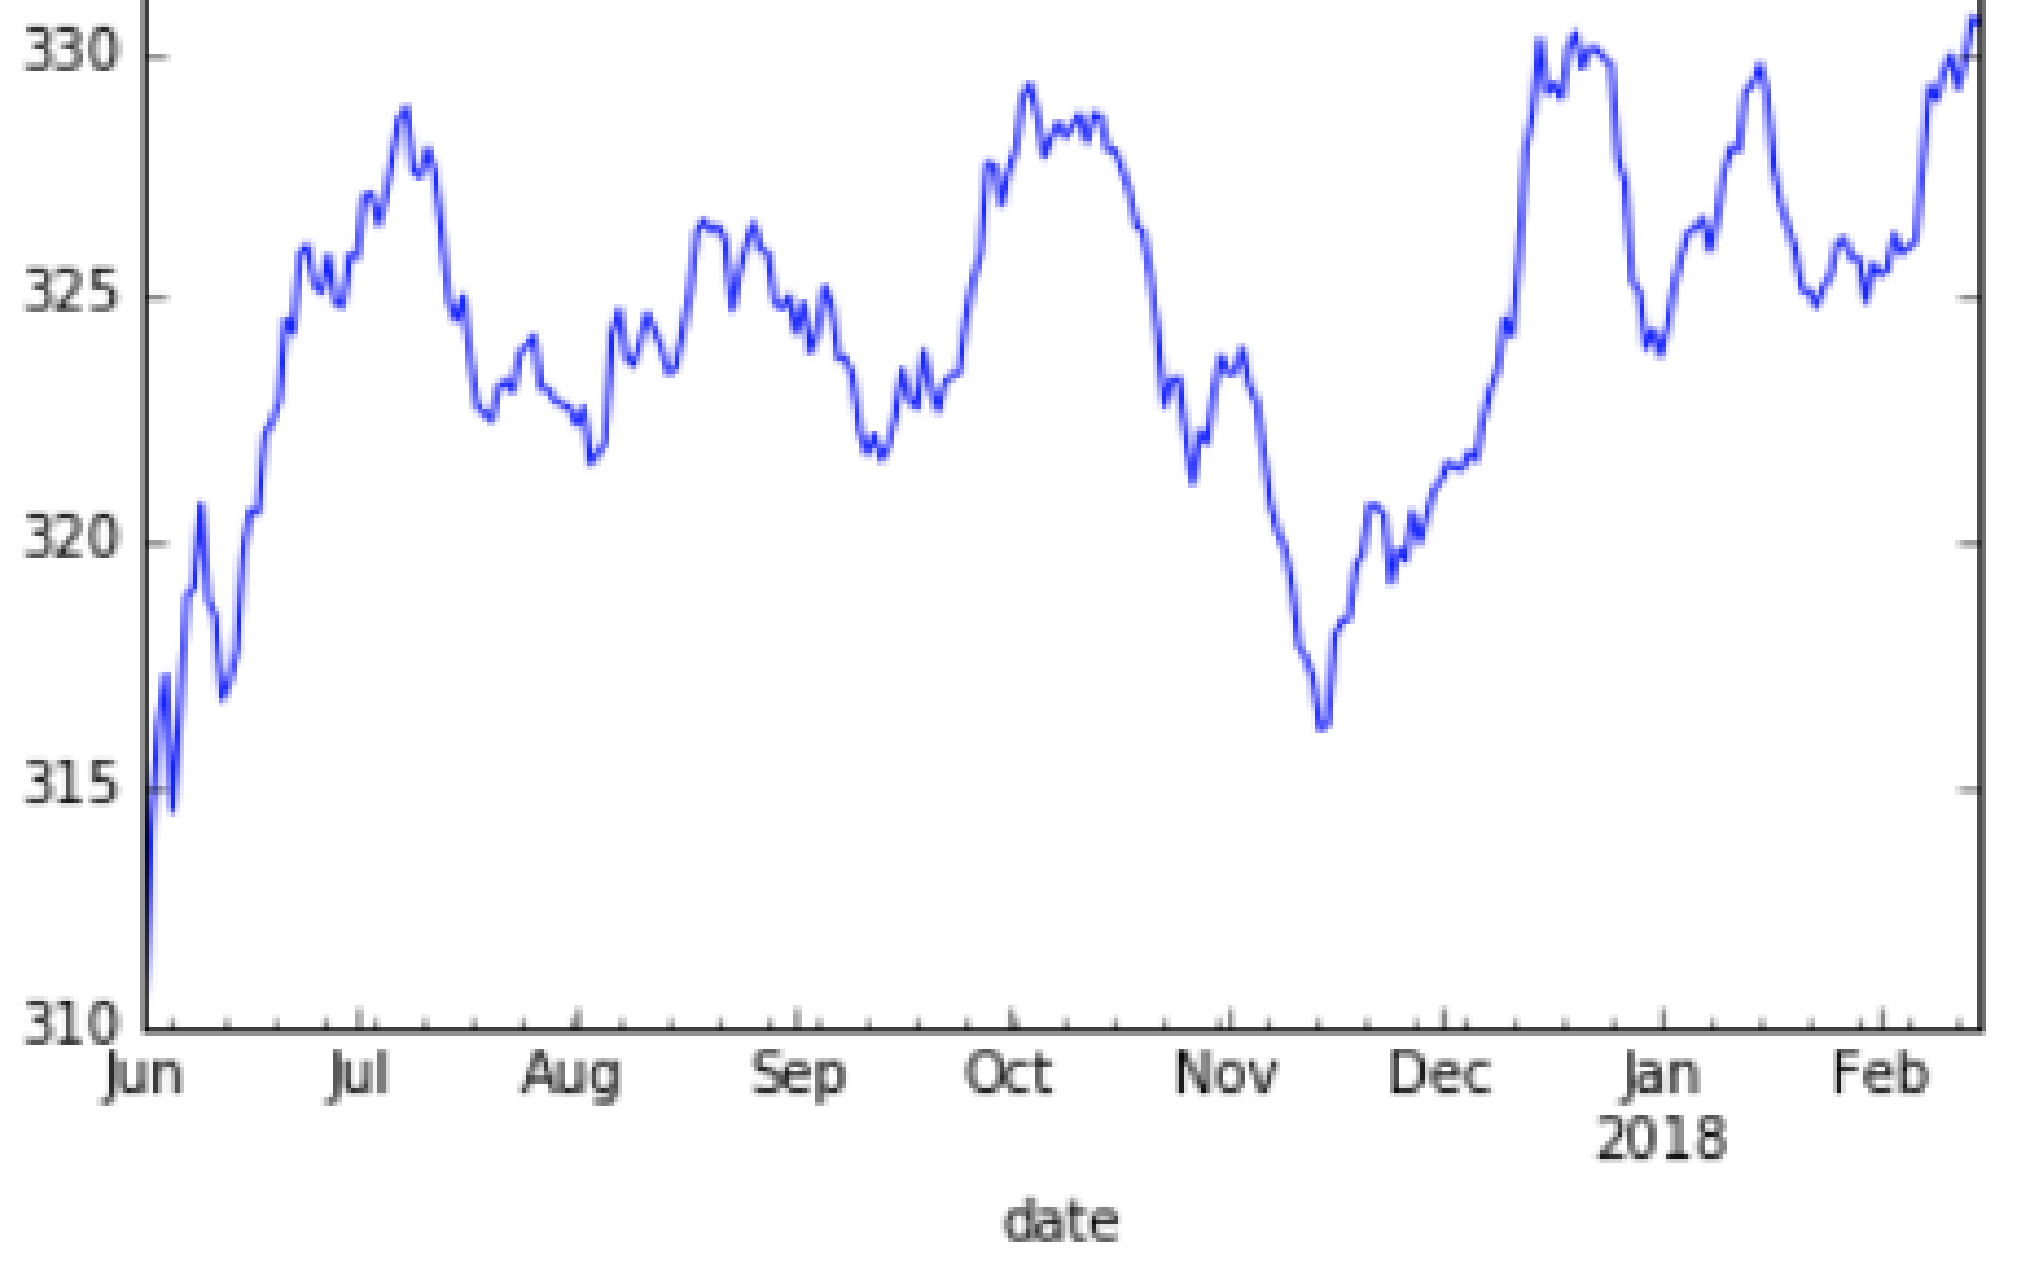
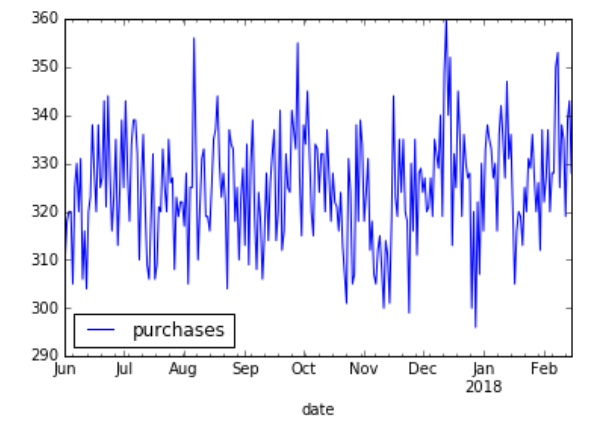
Noisy data - Highest SKU purchases by date
Smoothed purchases by date
High Sku Purchase Data