ค้นหาความสัมพันธ์ระหว่าง Time Series หลายชุด

การแสดงภาพข้อมูล Time Series ด้วย Python

Thomas Vincent

Head of Data Science, Getty Images

สหสัมพันธ์ระหว่างตัวแปรสองตัว

  • ในสถิติ ค่าสัมประสิทธิ์สหสัมพันธ์ใช้วัดความแข็งแกร่งหรือความไม่มีความสัมพันธ์ระหว่างตัวแปรสองตัว:
    • Pearson's coefficient ใช้คำนวณค่าสัมประสิทธิ์สหสัมพันธ์สำหรับตัวแปรที่คาดว่ามีความสัมพันธ์เชิงเส้น
    • Kendall Tau หรือ Spearman rank ใช้คำนวณค่าสัมประสิทธิ์สหสัมพันธ์สำหรับตัวแปรที่คาดว่ามีความสัมพันธ์แบบไม่เชิงเส้น
การแสดงภาพข้อมูล Time Series ด้วย Python

คำนวณสหสัมพันธ์

from scipy.stats.stats import pearsonr
from scipy.stats.stats import spearmanr
from scipy.stats.stats import kendalltau
x = [1, 2, 4, 7]
y = [1, 3, 4, 8]
pearsonr(x, y)
SpearmanrResult(correlation=0.9843, pvalue=0.01569)
spearmanr(x, y)
SpearmanrResult(correlation=1.0, pvalue=0.0)
kendalltau(x, y)
KendalltauResult(correlation=1.0, pvalue=0.0415)
การแสดงภาพข้อมูล Time Series ด้วย Python

เมทริกซ์สหสัมพันธ์คืออะไร?

  • เมื่อคำนวณค่าสัมประสิทธิ์สหสัมพันธ์ระหว่างตัวแปรมากกว่าสองตัว จะได้เมทริกซ์สหสัมพันธ์
    • ช่วงค่า: [-1, 1]
    • 0: ไม่มีความสัมพันธ์
    • 1: ความสัมพันธ์เชิงบวกสูง
    • -1: ความสัมพันธ์เชิงลบสูง
การแสดงภาพข้อมูล Time Series ด้วย Python

เมทริกซ์สหสัมพันธ์คืออะไร?

  • เมทริกซ์สหสัมพันธ์มีลักษณะ "สมมาตร" เสมอ
  • ค่าบนแนวทแยงมุมหลักจะเท่ากับ 1 เสมอ
   x     y     z
x  1.00 -0.46  0.49
y -0.46  1.00 -0.61
z  0.49 -0.61  1.00
การแสดงภาพข้อมูล Time Series ด้วย Python

คำนวณเมทริกซ์สหสัมพันธ์ด้วย Pandas

corr_p = meat[['beef', 'veal','turkey']].corr(method='pearson')
print(corr_p)
          beef     veal     turkey
beef      1.000   -0.829    0.738
veal     -0.829    1.000   -0.768
turkey    0.738   -0.768    1.000
corr_s = meat[['beef', 'veal','turkey']].corr(method='spearman')
print(corr_s)
          beef     veal     turkey
beef      1.000   -0.812    0.778
veal     -0.812    1.000   -0.829
turkey    0.778   -0.829    1.000
การแสดงภาพข้อมูล Time Series ด้วย Python

คำนวณเมทริกซ์สหสัมพันธ์ด้วย Pandas

corr_mat = meat.corr(method='pearson')
การแสดงภาพข้อมูล Time Series ด้วย Python

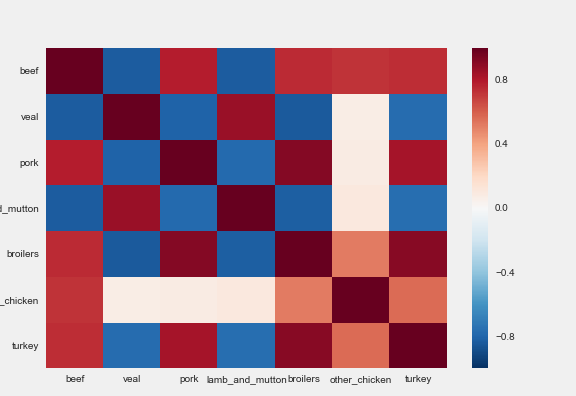
Heatmap

import seaborn as sns

sns.heatmap(corr_mat)
การแสดงภาพข้อมูล Time Series ด้วย Python

Heatmap

Heatmap ของเมทริกซ์สหสัมพันธ์

การแสดงภาพข้อมูล Time Series ด้วย Python

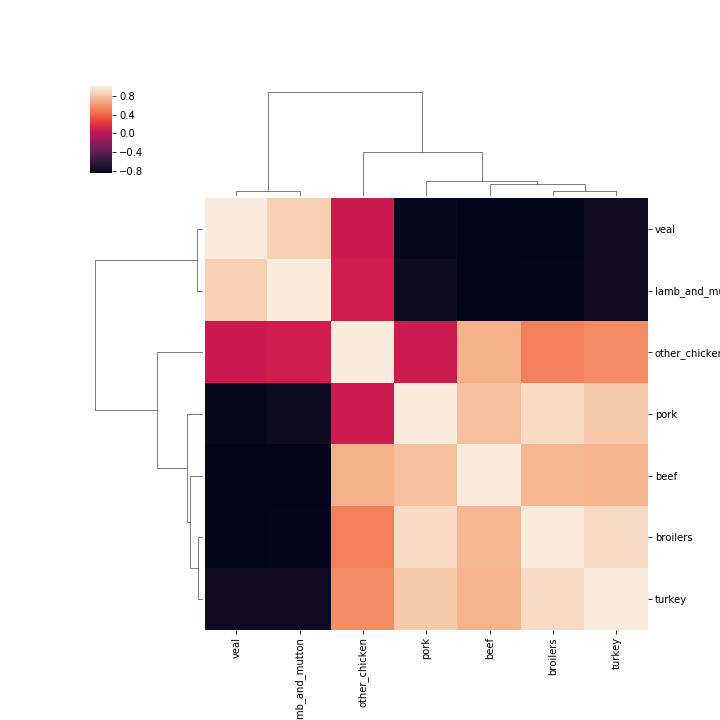
Clustermap

sns.clustermap(corr_mat)
การแสดงภาพข้อมูล Time Series ด้วย Python

Clustermap ของเมทริกซ์สหสัมพันธ์

การแสดงภาพข้อมูล Time Series ด้วย Python

มาฝึกกันเถอะ!

การแสดงภาพข้อมูล Time Series ด้วย Python

Preparing Video For Download...