Autocorrelation และ Partial Autocorrelation

การแสดงภาพข้อมูล Time Series ด้วย Python

Thomas Vincent

Head of Data Science, Getty Images

Autocorrelation ในข้อมูลอนุกรมเวลา

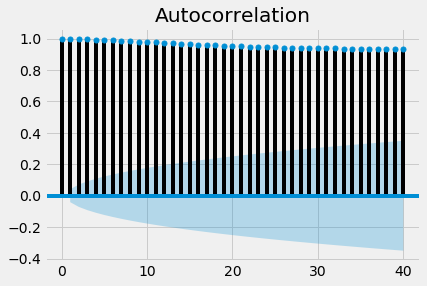
  • Autocorrelation คือค่าสหสัมพันธ์ระหว่างอนุกรมเวลากับสำเนาที่ล่าช้าของตัวเอง
  • ตัวอย่างเช่น autocorrelation อันดับ 3 คือค่าสหสัมพันธ์ระหว่างอนุกรมเวลา ณ จุด (t_1, t_2, t_3, ...) กับค่าที่ lag ไป 3 จุด คือ (t_4, t_5, t_6, ...)
  • ใช้สำหรับค้นหารูปแบบซ้ำหรือสัญญาณเป็นคาบในอนุกรมเวลา
การแสดงภาพข้อมูล Time Series ด้วย Python

Statsmodels

statsmodels คือโมดูล Python ที่มีคลาสและฟังก์ชันสำหรับการประมาณโมเดลทางสถิติหลายประเภท รวมถึงการทดสอบทางสถิติและการสำรวจข้อมูลทางสถิติ

การแสดงภาพข้อมูล Time Series ด้วย Python

การพล็อต Autocorrelation

import matplotlib.pyplot as plt
from statsmodels.graphics import tsaplots
fig = tsaplots.plot_acf(co2_levels['co2'], lags=40)

plt.show()
การแสดงภาพข้อมูล Time Series ด้วย Python

การตีความกราฟ Autocorrelation

Autocorrelation ในอนุกรมเวลา

การแสดงภาพข้อมูล Time Series ด้วย Python

Partial Autocorrelation ในข้อมูลอนุกรมเวลา

  • ต่างจาก autocorrelation ตรงที่ partial autocorrelation จะตัดผลกระทบของจุดเวลาก่อนหน้าออก
  • ตัวอย่างเช่น partial autocorrelation function ที่ order 3 คือค่าสหสัมพันธ์ระหว่างอนุกรมเวลา (t1, t2, t3, ...) กับค่าที่ lag ไป 3 จุด (t4, t5, t6, ...) หลังจากนำผลกระทบของ lag 1 และ 2 ออกแล้ว
การแสดงภาพข้อมูล Time Series ด้วย Python

การพล็อต Partial Autocorrelation

import matplotlib.pyplot as plt

from statsmodels.graphics import tsaplots
fig = tsaplots.plot_pacf(co2_levels['co2'], lags=40)

plt.show()
การแสดงภาพข้อมูล Time Series ด้วย Python

การตีความกราฟ Partial Autocorrelation
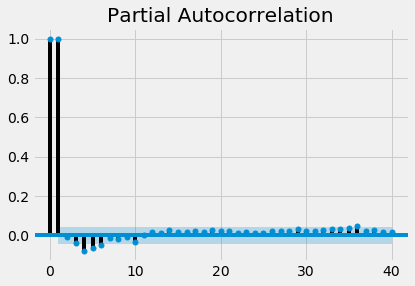
Partial Autocorrelation ในอนุกรมเวลา

การแสดงภาพข้อมูล Time Series ด้วย Python

มาฝึกกันเถอะ!

การแสดงภาพข้อมูล Time Series ด้วย Python

Preparing Video For Download...