ฤดูกาล แนวโน้ม และสัญญาณรบกวนในข้อมูลอนุกรมเวลา

การแสดงภาพข้อมูล Time Series ด้วย Python

Thomas Vincent

Head of Data Science, Getty Images

คุณสมบัติของอนุกรมเวลา
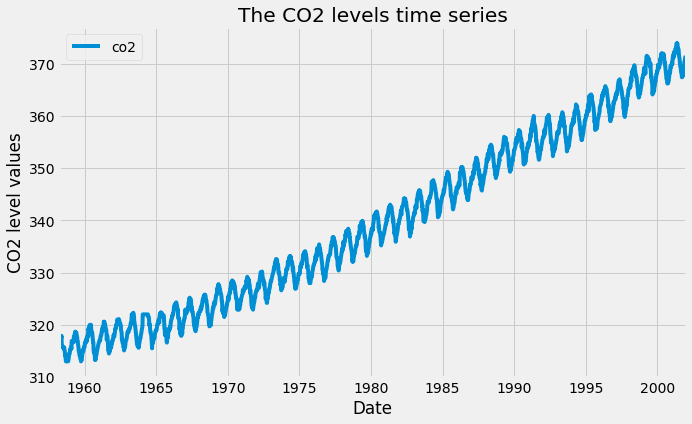
คุณสมบัติของอนุกรมเวลา

การแสดงภาพข้อมูล Time Series ด้วย Python

คุณสมบัติของอนุกรมเวลา

  • ฤดูกาล (Seasonality): ข้อมูลมีรูปแบบซ้ำเป็นช่วงๆ หรือไม่?
  • แนวโน้ม (Trend): ข้อมูลมีทิศทางขึ้นหรือลงอย่างต่อเนื่องหรือไม่?
  • สัญญาณรบกวน (Noise): มีค่าผิดปกติหรือข้อมูลสูญหายที่ไม่สอดคล้องกับข้อมูลส่วนที่เหลือหรือไม่?
การแสดงภาพข้อมูล Time Series ด้วย Python

การแยกองค์ประกอบอนุกรมเวลา

import statsmodels.api as sm
import matplotlib.pyplot as plt
from pylab import rcParams

rcParams['figure.figsize'] = 11, 9
decomposition = sm.tsa.seasonal_decompose(
                co2_levels['co2'])
fig = decomposition.plot()

plt.show()
การแสดงภาพข้อมูล Time Series ด้วย Python

กราฟการแยกองค์ประกอบอนุกรมเวลาของข้อมูล CO2
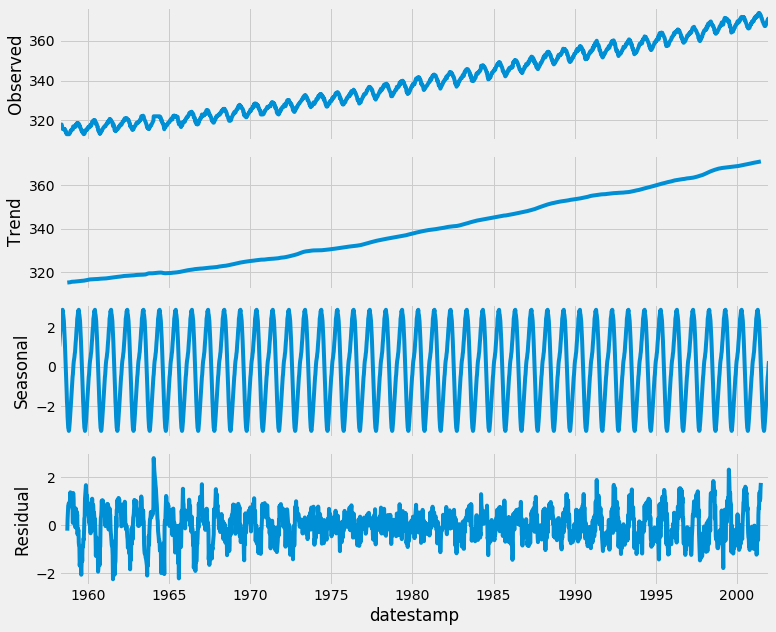
การแยกองค์ประกอบอนุกรมเวลา

การแสดงภาพข้อมูล Time Series ด้วย Python

การดึงองค์ประกอบจากการแยกอนุกรมเวลา

print(dir(decomposition))
['__class__', '__delattr__', '__dict__',
 ... 'plot', 'resid', 'seasonal', 'trend']
print(decomposition.seasonal)
datestamp
1958-03-29    1.028042
1958-04-05    1.235242
1958-04-12    1.412344
1958-04-19    1.701186
การแสดงภาพข้อมูล Time Series ด้วย Python

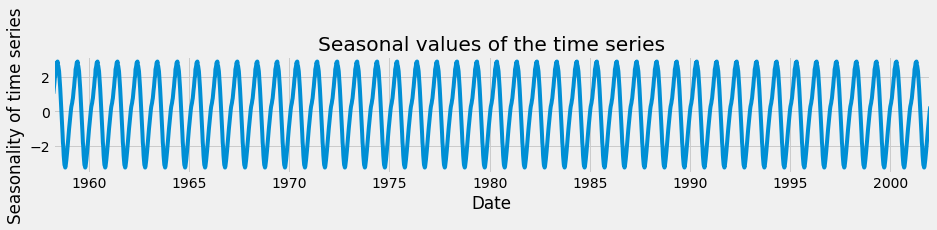
องค์ประกอบฤดูกาลในอนุกรมเวลา

decomp_seasonal = decomposition.seasonal

ax = decomp_seasonal.plot(figsize=(14, 2))
ax.set_xlabel('Date')
ax.set_ylabel('Seasonality of time series')
ax.set_title('Seasonal values of the time series')

plt.show()
การแสดงภาพข้อมูล Time Series ด้วย Python

องค์ประกอบฤดูกาลในอนุกรมเวลา

ฤดูกาลในอนุกรมเวลา

การแสดงภาพข้อมูล Time Series ด้วย Python

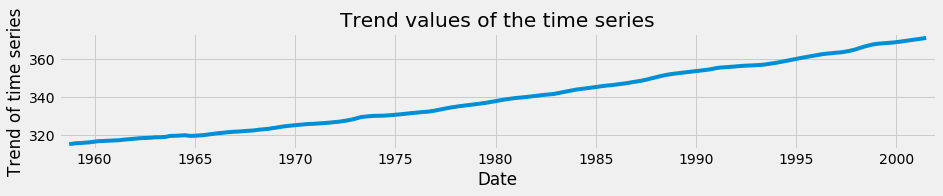
องค์ประกอบแนวโน้มในอนุกรมเวลา

decomp_trend = decomposition.trend

ax = decomp_trend.plot(figsize=(14, 2))
ax.set_xlabel('Date')
ax.set_ylabel('Trend of time series')
ax.set_title('Trend values of the time series')

plt.show()
การแสดงภาพข้อมูล Time Series ด้วย Python

องค์ประกอบแนวโน้มในอนุกรมเวลา

แนวโน้มในอนุกรมเวลา

การแสดงภาพข้อมูล Time Series ด้วย Python

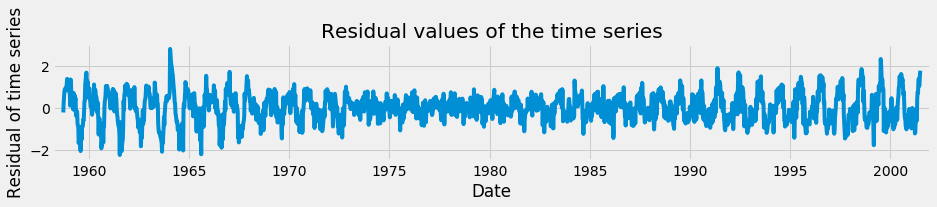
องค์ประกอบสัญญาณรบกวนในอนุกรมเวลา

decomp_resid = decomp.resid

ax = decomp_resid.plot(figsize=(14, 2))
ax.set_xlabel('Date')
ax.set_ylabel('Residual of time series')
ax.set_title('Residual values of the time series')

plt.show()
การแสดงภาพข้อมูล Time Series ด้วย Python

องค์ประกอบสัญญาณรบกวนในอนุกรมเวลา

สัญญาณรบกวนในอนุกรมเวลา

การแสดงภาพข้อมูล Time Series ด้วย Python

มาฝึกกันเถอะ!

การแสดงภาพข้อมูล Time Series ด้วย Python

Preparing Video For Download...