ยินดีด้วย!

การจัดการข้อมูลที่หายไปใน R

Nicholas Tierney

Statistician

บทที่ 1

ค่าที่หายไปคืออะไร

ค่าที่หายไปคือค่าที่ควรถูกบันทึกแต่ไม่ได้ถูกบันทึก

วิธีสรุปข้อมูลค่าที่หายไป

miss_var_summary(airquality)
A tibble: 6 x 3
  variable n_miss pct_miss 
  <chr>     <int>    <dbl> 
1 Ozone        37    24.2  
2 Solar.R       7     4.58 
3 Wind          0     0    
4 Temp          0     0    
5 Month         0     0    
6 Day           0     0
การจัดการข้อมูลที่หายไปใน R

บทที่ 1

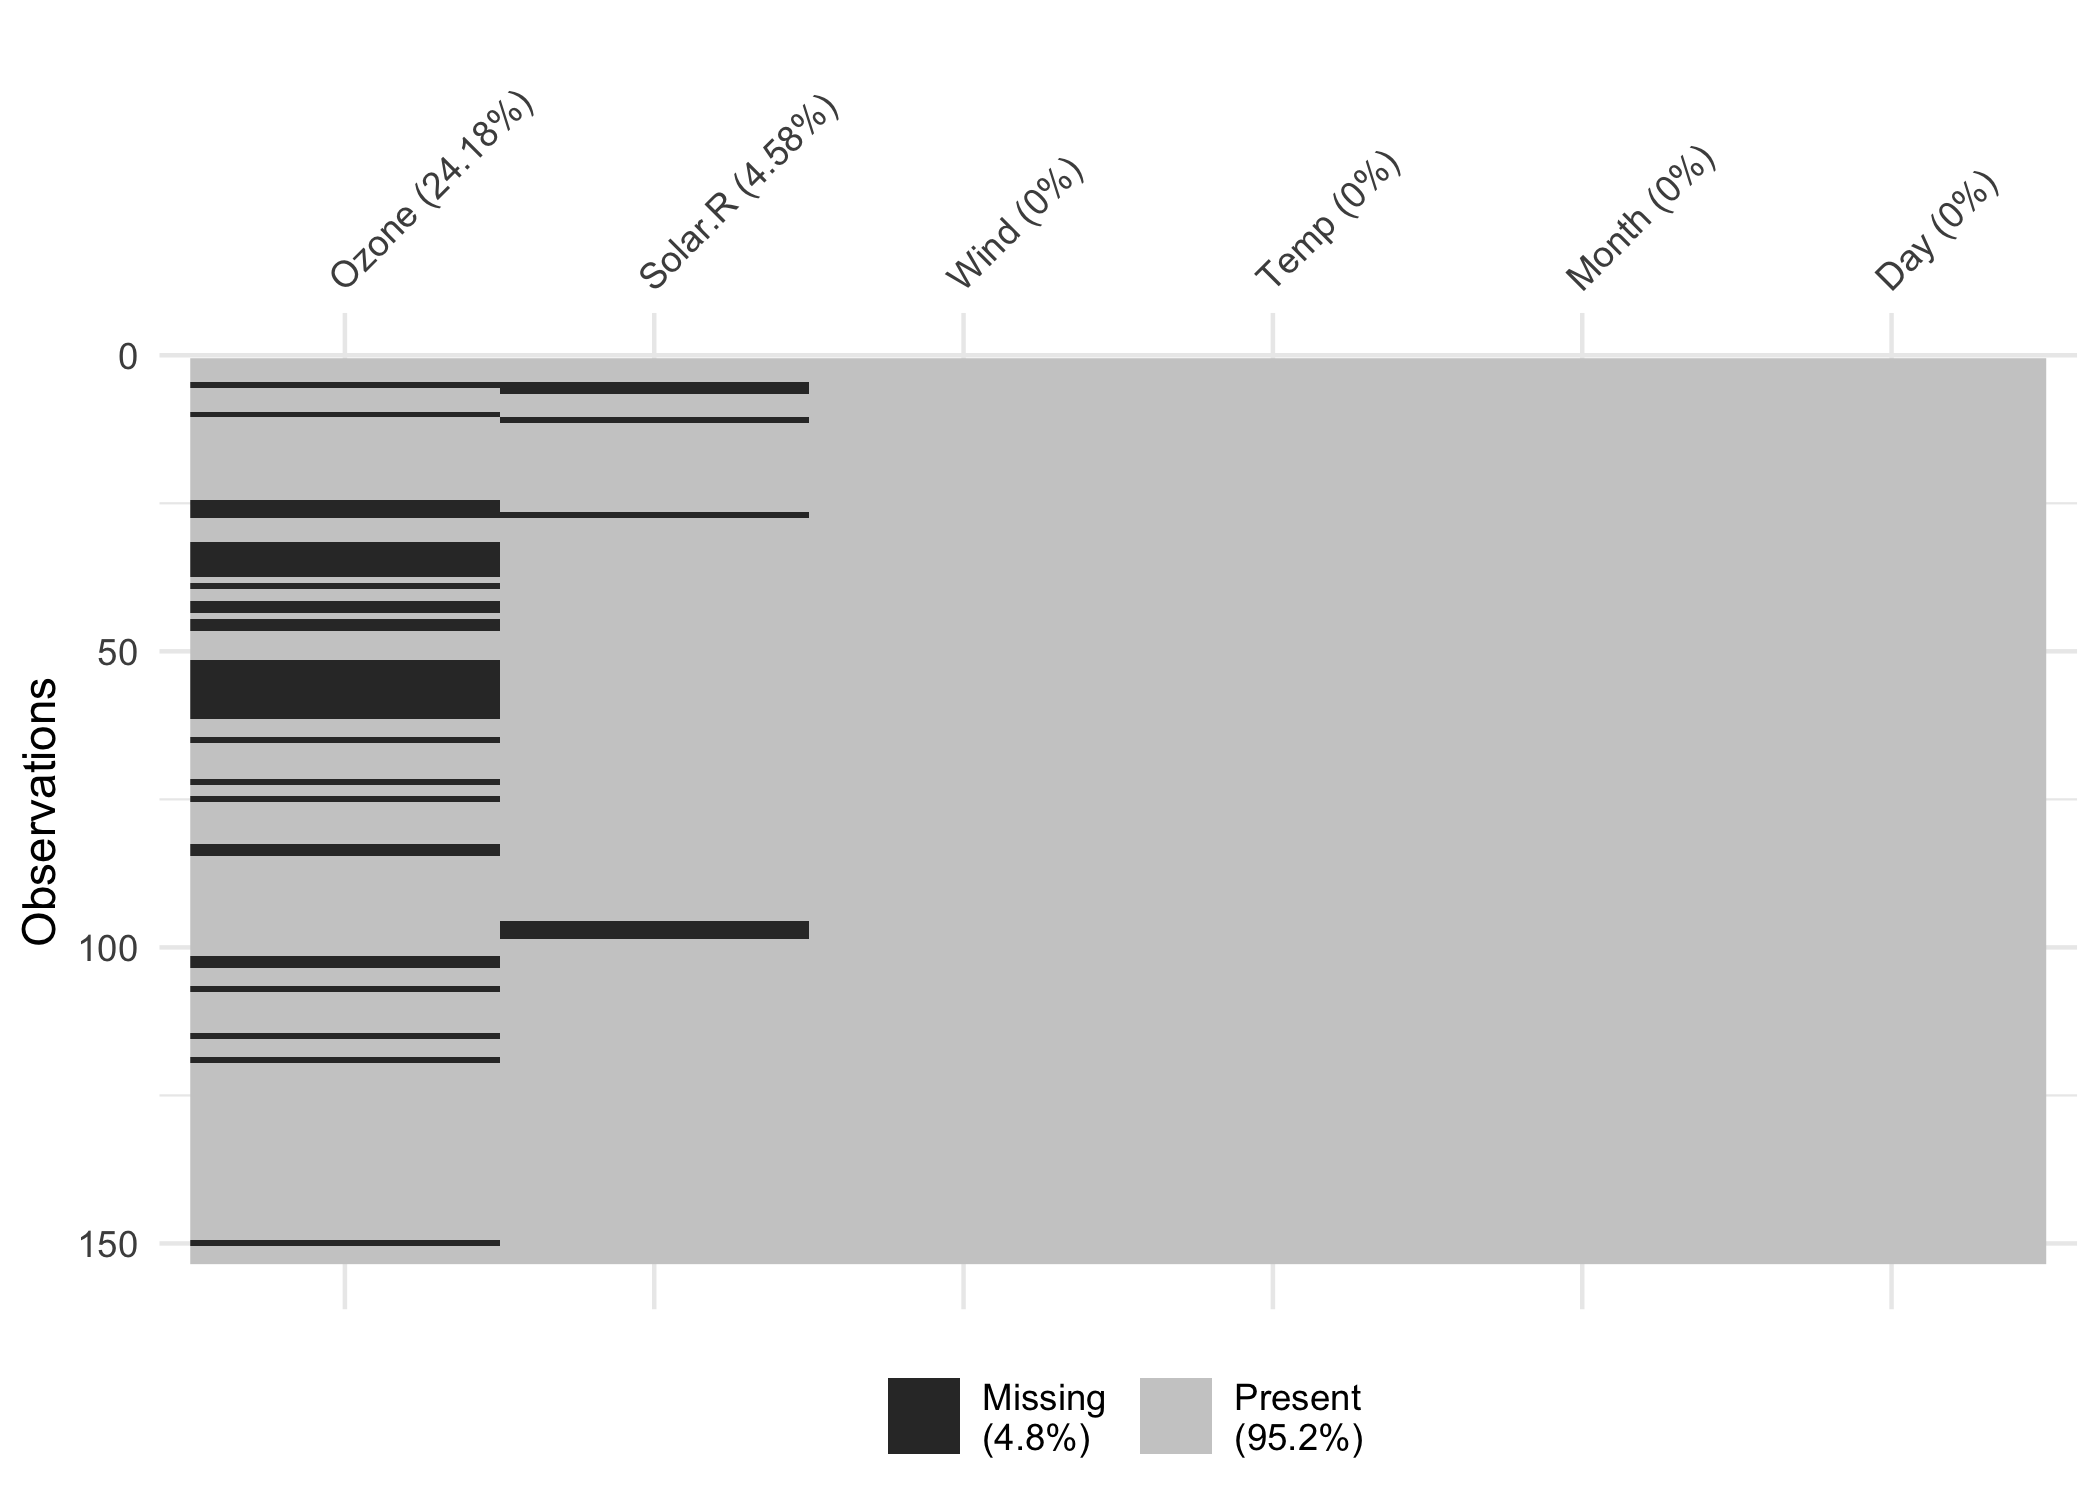
vis_miss(airquality)

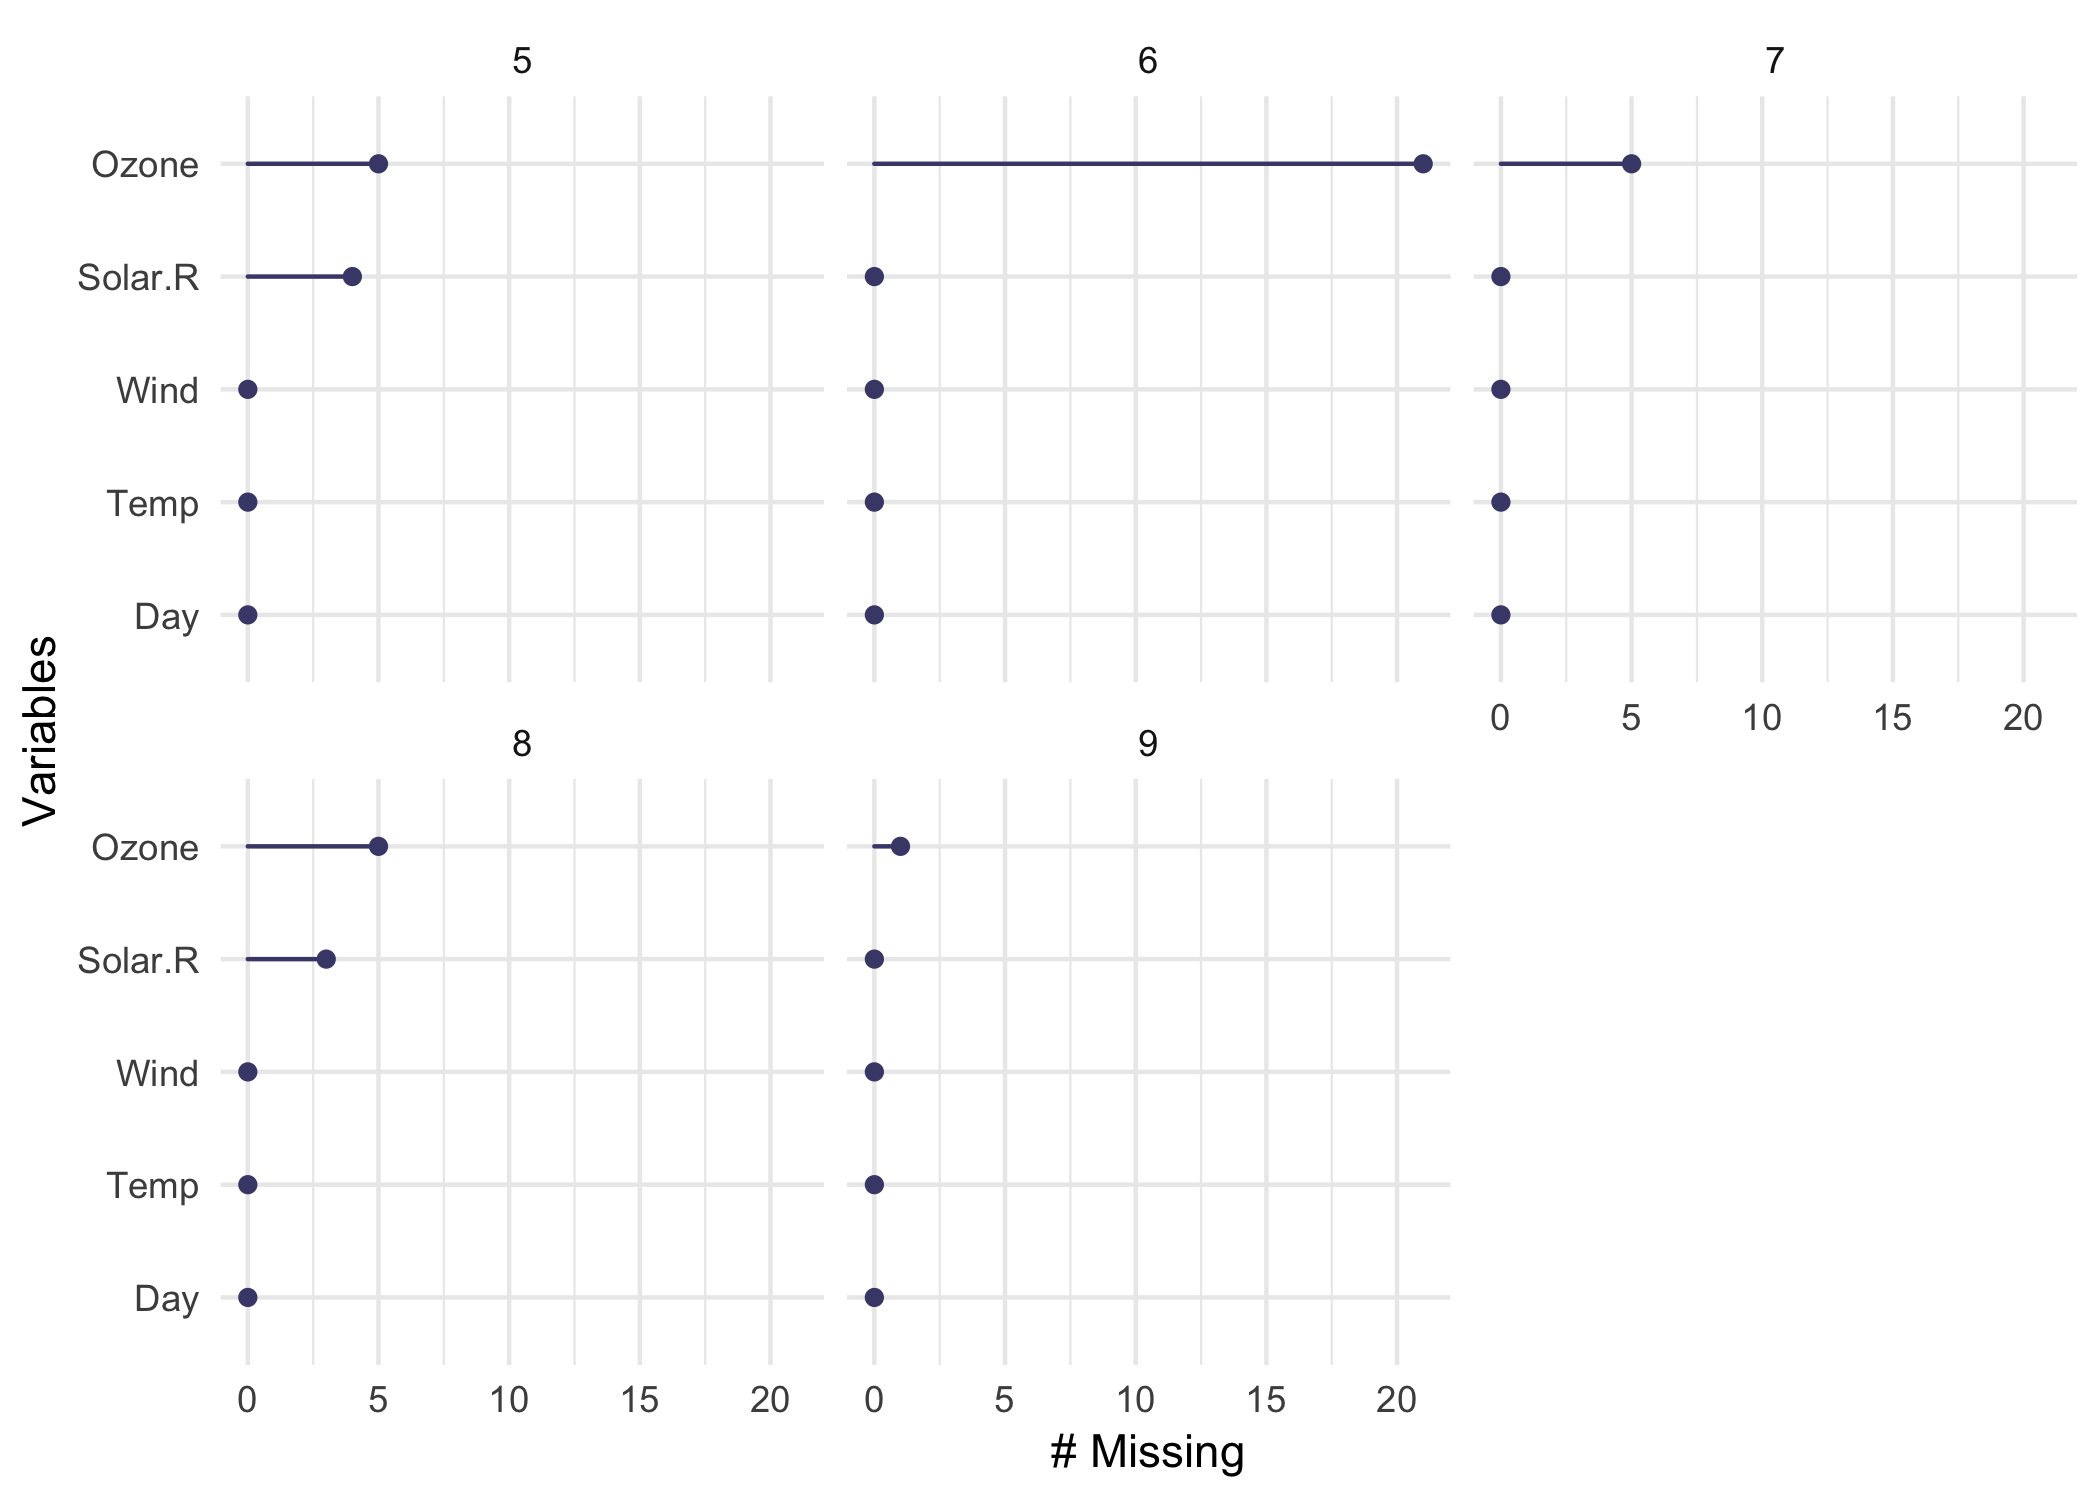
gg_miss_var(airquality, facet=Month)
การจัดการข้อมูลที่หายไปใน R

บทที่ 2

ค้นหาค่าที่หายไปในรูปแบบอื่น

miss_scan_count(data = pacman, 
                search = list("N/A"))

แทนที่ค่าที่หายไปในรูปแบบอื่น

replace_with_na(pacman, 
                replace = list(
                  year = c("N/A"),
                  score = c("N/A")))

ค่าที่หายไปโดยนัย

frogger_tidy <- frogger %>% 
  complete(time, name)

การพึ่งพิงของข้อมูลที่หายไป

  • MCAR
  • MAR
  • MNAR
การจัดการข้อมูลที่หายไปใน R

บทที่ 3

shadow matrix, nabular data

nabular(airquality)
 # A tibble: 153 x 12
    Ozone Solar.R  Wind  Temp 
    <int>   <int> <dbl> <int> 
  1   41     190   7.4    67  
  2   36     118   8      72  
  3   12     149  12.6    74  
 # ... with 150 more rows, and 3 
 # more variables: Month <int>, Day <int>,
 # Ozone_NA <fct>, Solar.R_NA <fct>, 
 # Wind_NA <fct>, Temp_NA <fct>,
 # Month_NA <fct>, Day_NA <fct>

สำรวจค่าที่หายไป และเชื่อมสรุปผลกับค่าในข้อมูล

oceanbuoys %>%
  bind_shadow() %>%
  group_by(humidity_NA) %>%
  summarize(
    wind_ew_mean = mean(wind_ew))
 # A tibble: 2 x 2
   humidity_NA wind_ew_mean
   <fct>              <dbl>
 1 !NA                -3.78
 2 NA                 -3.30
การจัดการข้อมูลที่หายไปใน R

บทที่ 3

การเปลี่ยนแปลงของค่าเมื่อมีข้อมูลหายไป

nabular(oceanbuoys) %>%
  ggplot(aes(x = wind_ew, 
             color = air_temp_c_NA)) + 
  geom_density()
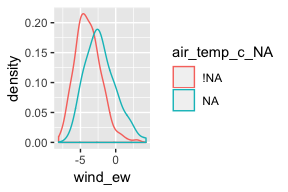
กราฟความหนาแน่นของ ggplot แยกตามอุณหภูมิอากาศ

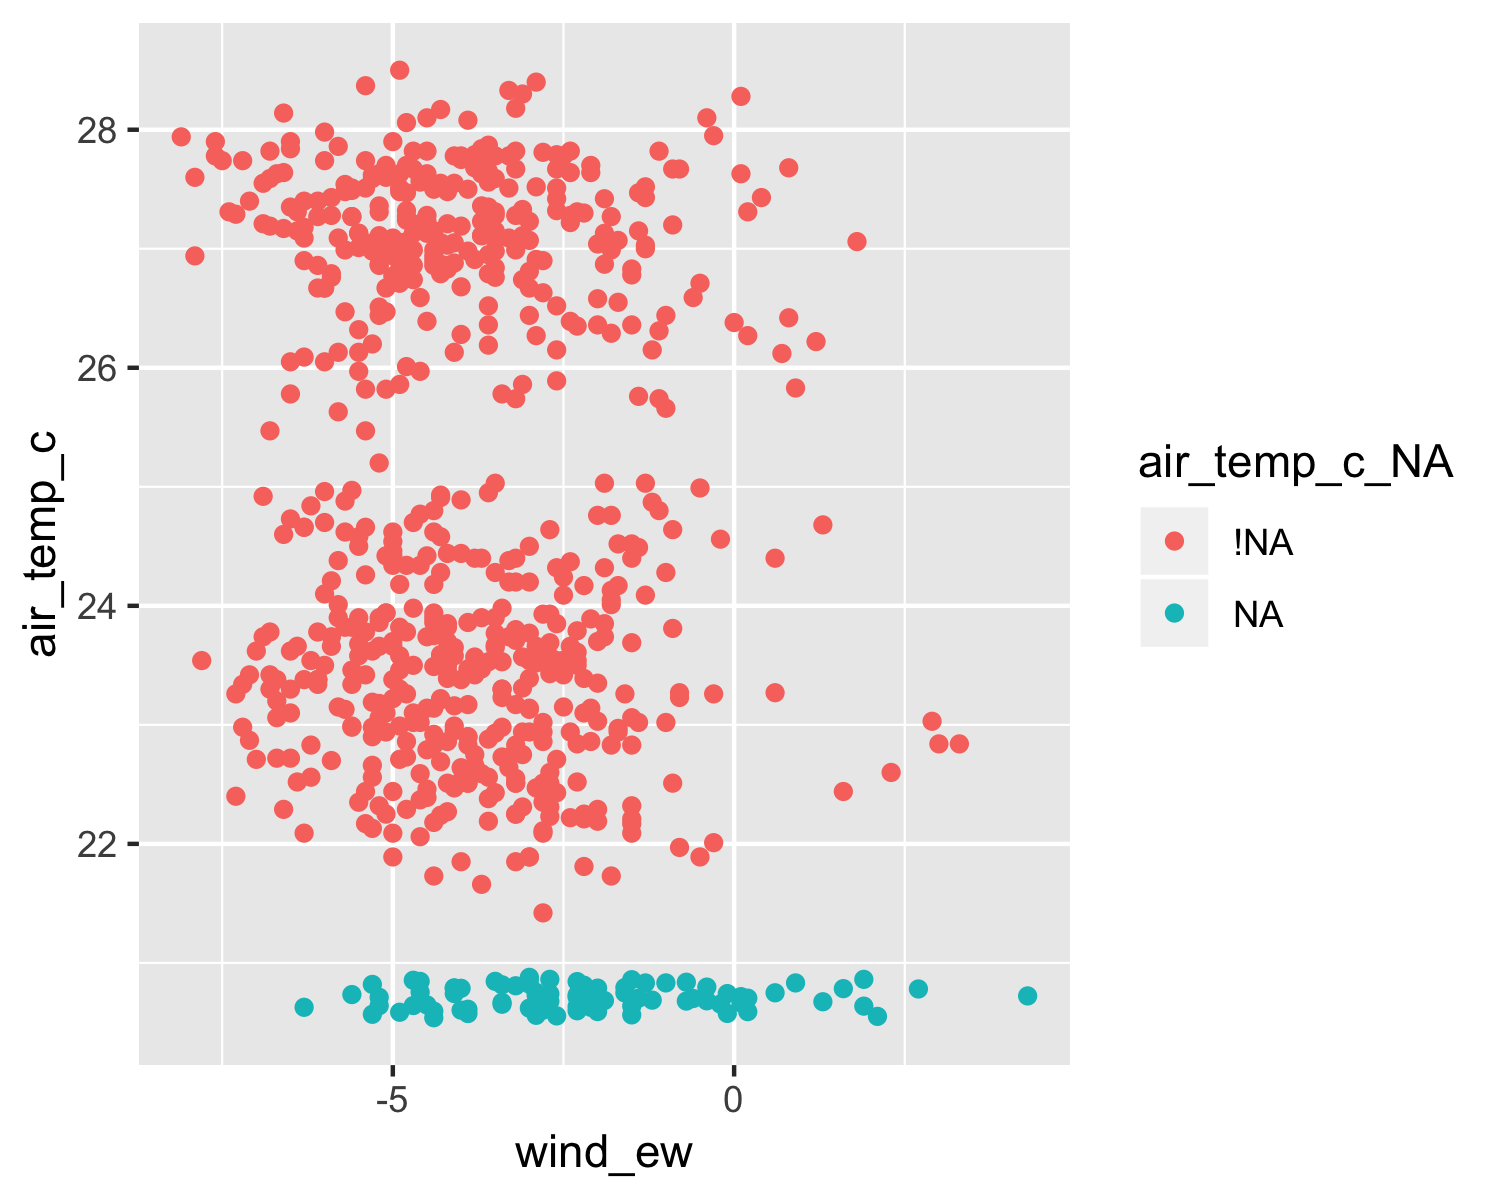
แสดงภาพค่าที่หายไปใน 2 ตัวแปร

ggplot(oceanbuoys,
       aes(x = wind_ew,
           y = air_temp_c)) + 
  geom_miss_point()
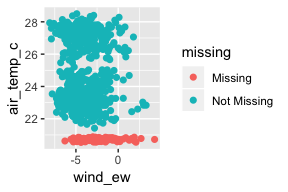
gg-miss-point

การจัดการข้อมูลที่หายไปใน R

บทที่ 4

การ impute ที่ดีและไม่ดี

naniar::impute_mean_all()
simputation::impute_lm()
impuate-mean-image

เปรียบเทียบค่าที่ถูก impute กับค่าเดิม

ggplot(ocean_imp_track, 
       aes(x = air_temp_c, 
           fill = air_temp_c_NA)) + 
  geom_histogram()
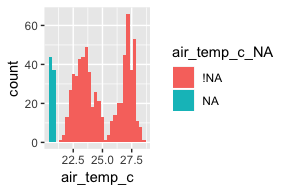
impute-hist

การจัดการข้อมูลที่หายไปใน R

บทที่ 4

การใช้โมเดล imputation ที่แตกต่างกัน
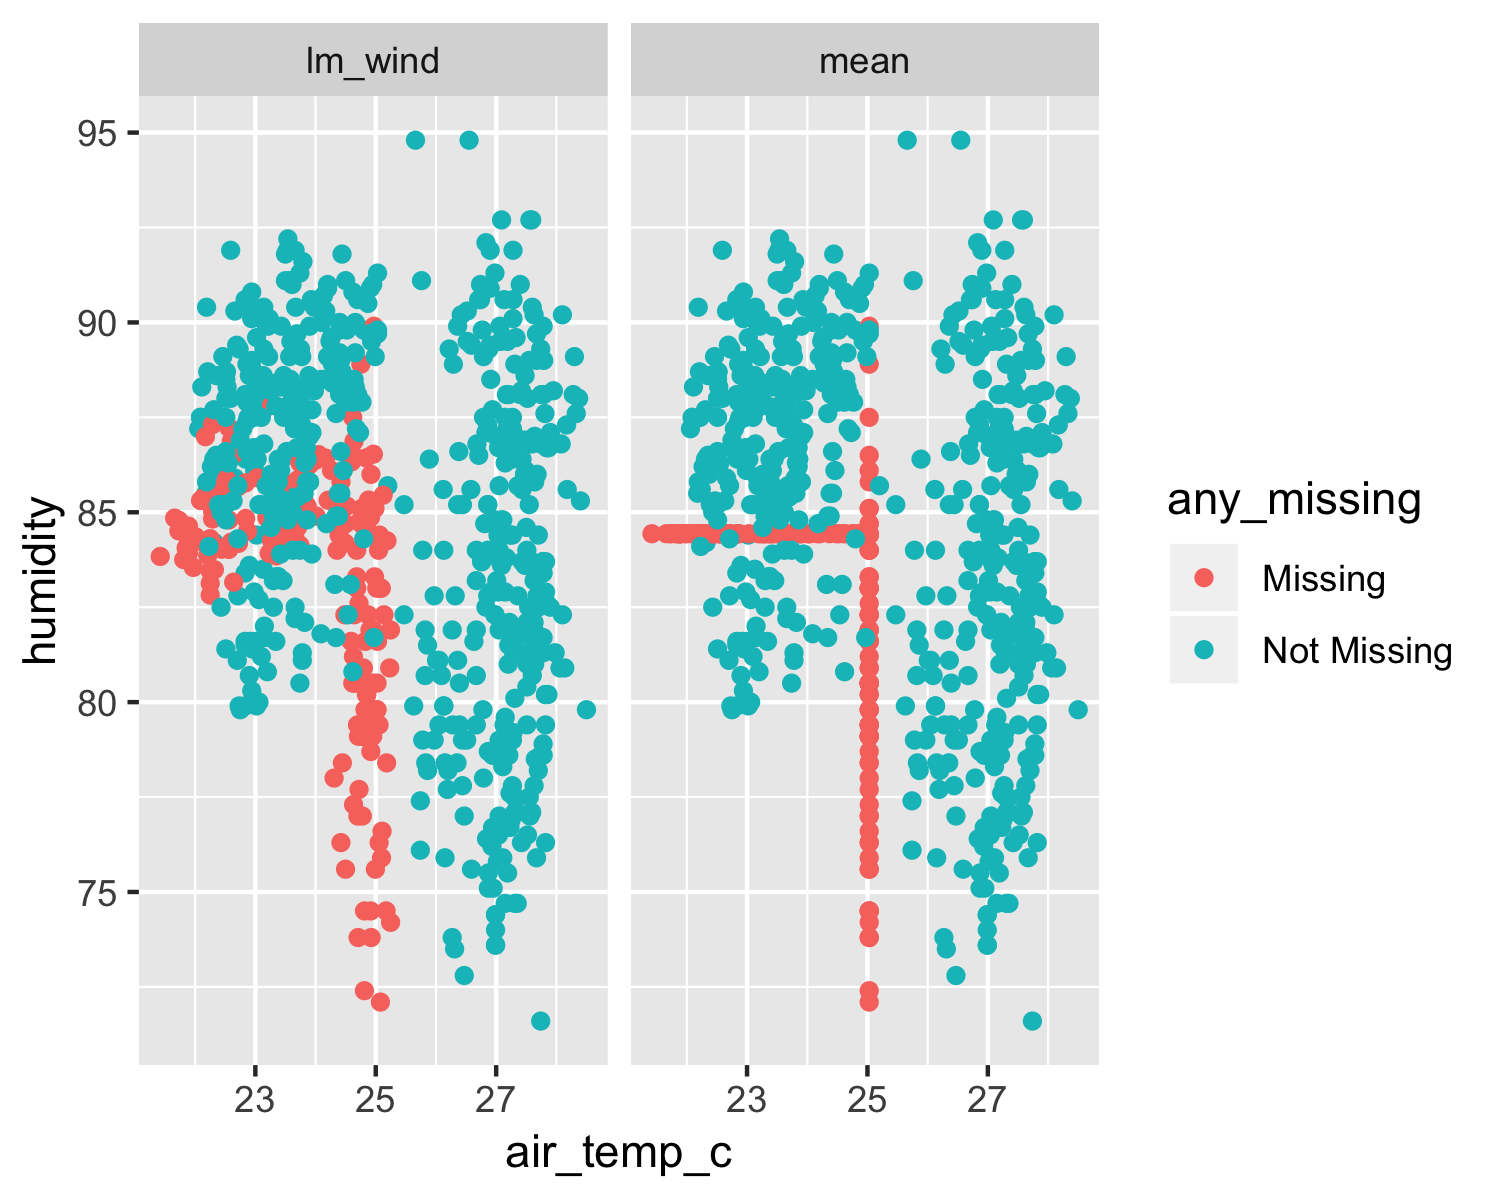
เปรียบเทียบการ impute ด้วยโมเดล linear กับค่าเฉลี่ย

ผลของโมเดล imputation ต่อการวิเคราะห์เชิงสถิติ

# A tibble: 12 x 6
   imp_model term  estimate
   <chr>     <chr>    <dbl>
 1 cc        (Int… -7.35e+2
 2 cc        air_…  8.64e-1
 3 cc        humi…  3.41e-2
 4 cc        year   3.69e-1
 5 imp_lm_w… (Int… -1.71e+3
 6 imp_lm_w… air_…  3.78e-1
# ... 6 more rows
# ... with 3 more variables:
#   std.error <dbl>,
#   statistic <dbl>,
#   p.value <dbl>
การจัดการข้อมูลที่หายไปใน R

นี่เป็นเพียงจุดเริ่มต้น!

การจัดการข้อมูลที่หายไปใน R

ขอบคุณ!

การจัดการข้อมูลที่หายไปใน R

Preparing Video For Download...