시계열 간의 관계: 상관관계

Python으로 시계열 데이터 다루기

Stefan Jansen

Founder & Lead Data Scientist at Applied Artificial Intelligence

상관관계 & 시계열 간의 관계

  • 지금까지: 개별 변수의 특성에 집중
  • 이제: 변수 간의 관계 특성 살펴보기
  • 상관관계: 선형 관계를 측정
  • 금융 시장: 예측 및 리스크 관리에 중요
  • pandas & seaborn으로 계산 및 시각화 가능
Python으로 시계열 데이터 다루기

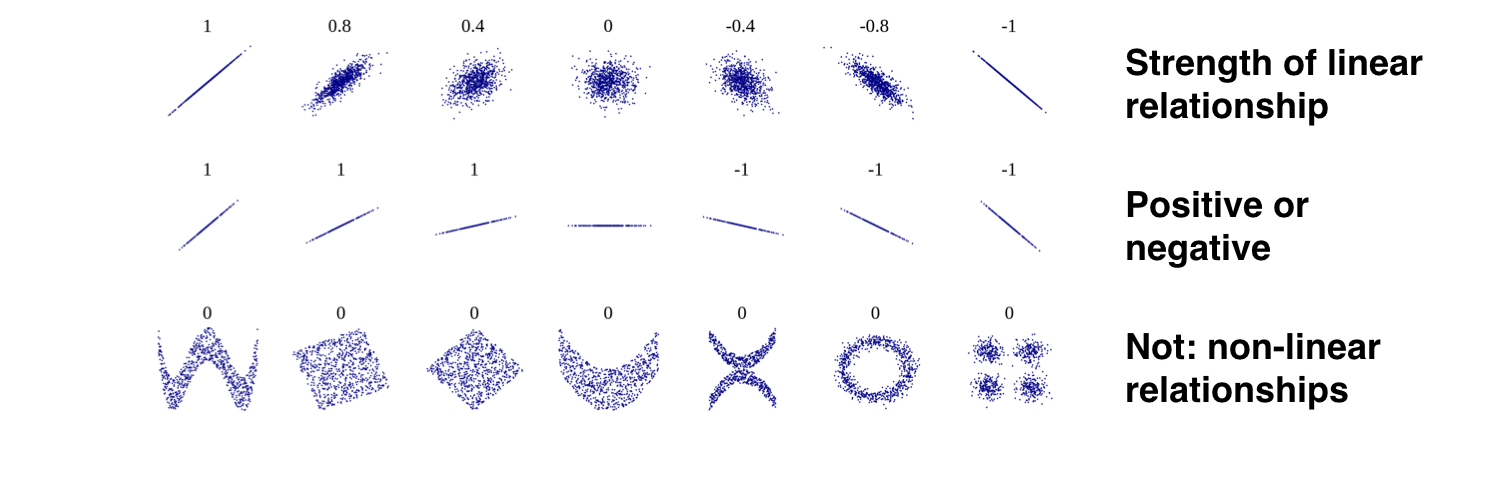
상관관계 & 선형 관계

  • 상관계수: 두 변수가 각자의 평균을 중심으로 얼마나 유사하게 움직이는지 측정
  • -1+1 사이의 값 $\ \ \ \ \ r = \frac{\sum_{i=1}^{N} (x_i - \bar{x})(y_i - \bar{y})}{s_xs_y}$
 

ch3_4_v2 - Correlation & Heatmaps.011.png

Python으로 시계열 데이터 다루기

5개 가격 시계열 불러오기

data = pd.read_csv('assets.csv', parse_dates=['date'], 
                   index_col='date')

data = data.dropna().info()
DatetimeIndex: 2469 entries, 2007-05-25 to 2017-05-22
Data columns (total 5 columns):
sp500     2469 non-null float64
nasdaq    2469 non-null float64
bonds     2469 non-null float64
gold      2469 non-null float64
oil       2469 non-null float64
Python으로 시계열 데이터 다루기

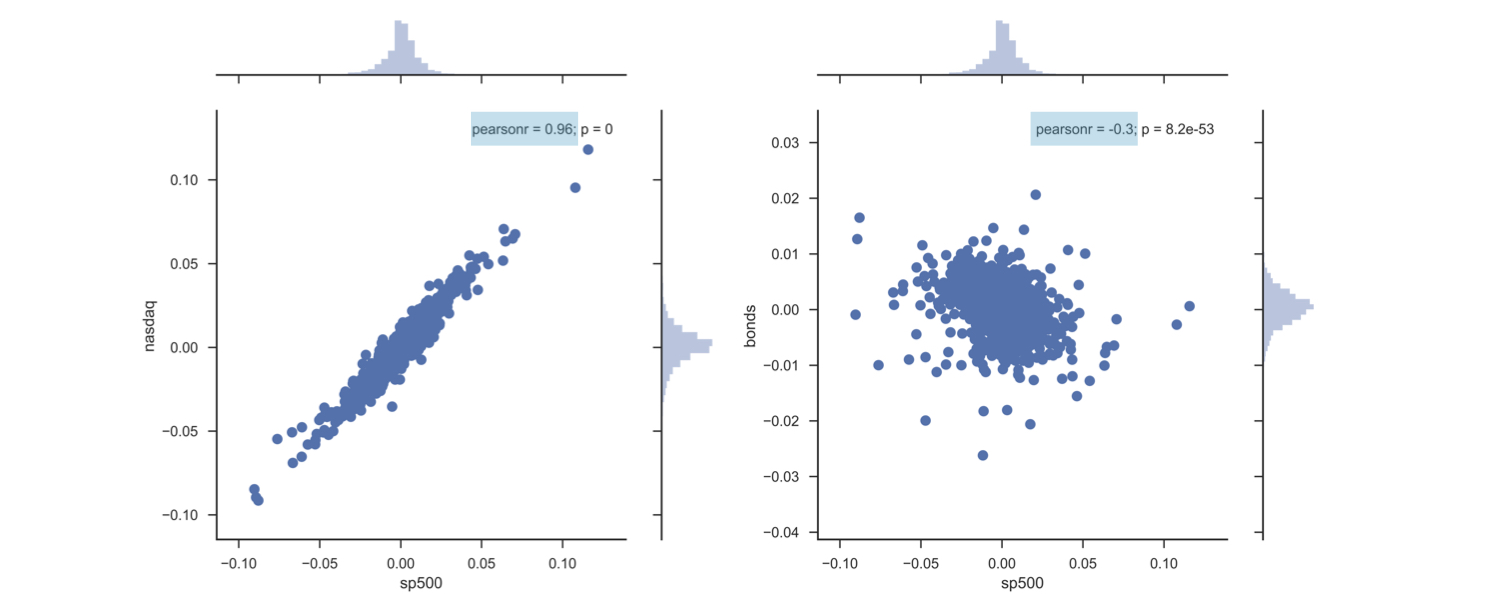
쌍별 선형 관계 시각화

daily_returns = data.pct_change()

sns.jointplot(x='sp500', y='nasdaq', data=data_returns);
ch3_4_v2 - Correlation & Heatmaps.015.png

Python으로 시계열 데이터 다루기

전체 상관관계 계산

correlations = returns.corr()

correlations
bonds       oil      gold     sp500    nasdaq
bonds   1.000000 -0.183755  0.003167 -0.300877 -0.306437
oil    -0.183755  1.000000  0.105930  0.335578  0.289590
gold    0.003167  0.105930  1.000000 -0.007786 -0.002544
sp500  -0.300877  0.335578 -0.007786  1.000000  0.959990
nasdaq -0.306437  0.289590 -0.002544  0.959990  1.000000
Python으로 시계열 데이터 다루기

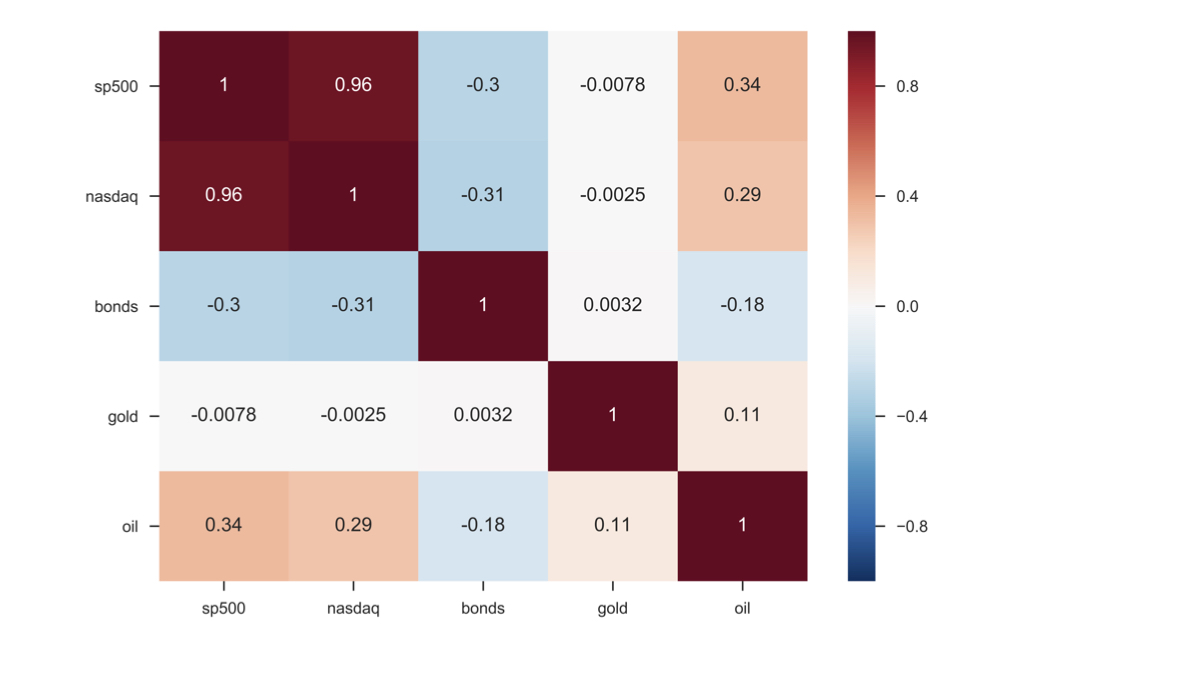
전체 상관관계 시각화

sns.heatmap(correlations, annot=True)
ch3_4_v2 - Correlation & Heatmaps.019.png

Python으로 시계열 데이터 다루기

연습해 봅시다!

Python으로 시계열 데이터 다루기

Preparing Video For Download...