업샘플링 & .resample()을 활용한 보간

Python으로 시계열 데이터 다루기

Stefan Jansen

Founder & Lead Data Scientist at Applied Artificial Intelligence

빈도 변환 및 변환 메서드

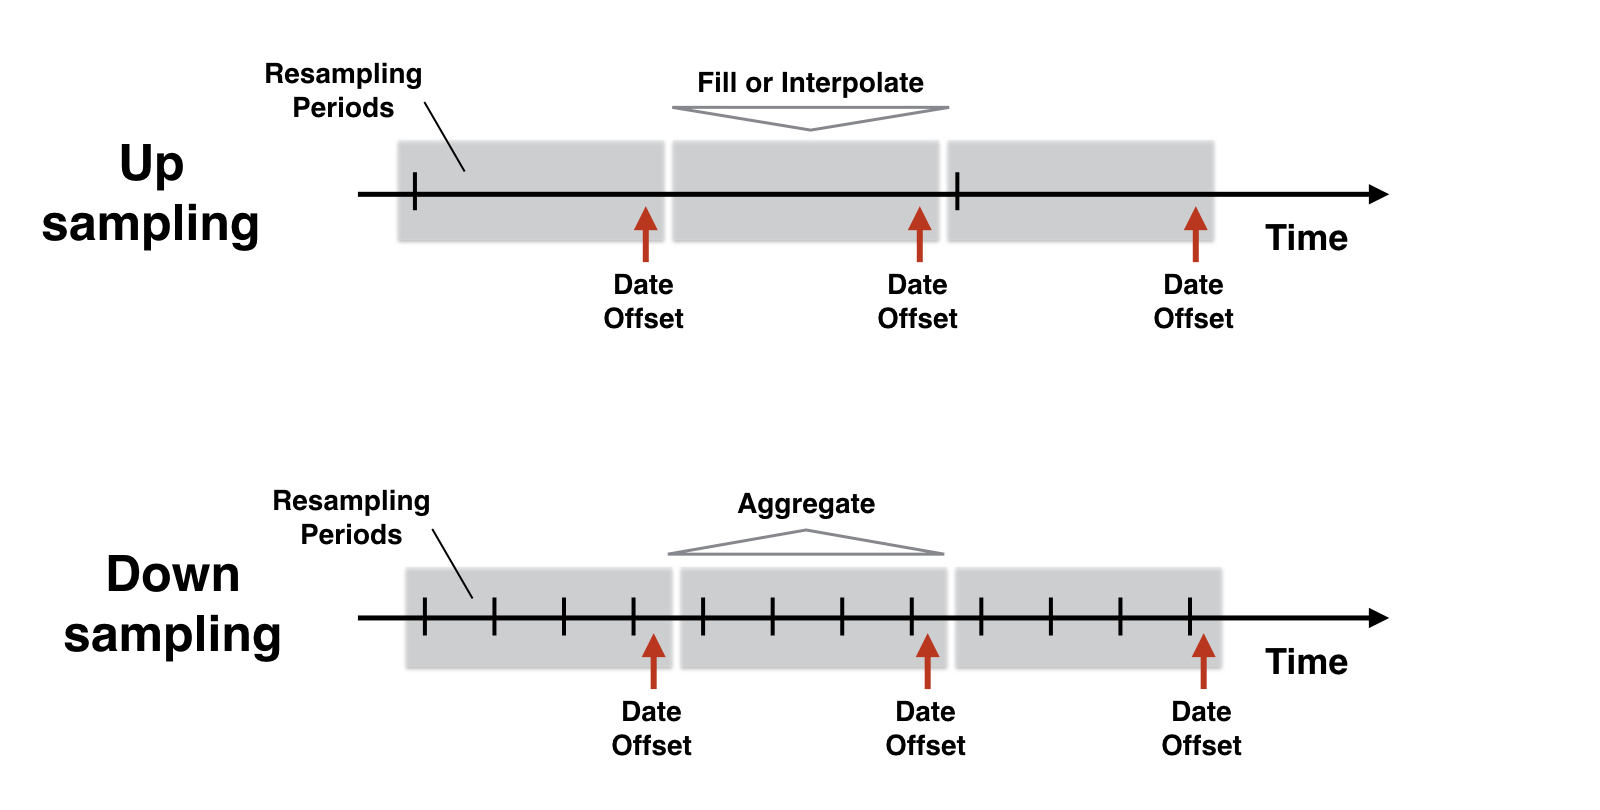
  • .resample(): .groupby()와 유사

  • 리샘플링 기간 내 데이터를 그룹화하고 각 그룹에 하나 이상의 메서드를 적용

  • 새 날짜는 오프셋(시작, 끝 등)으로 결정

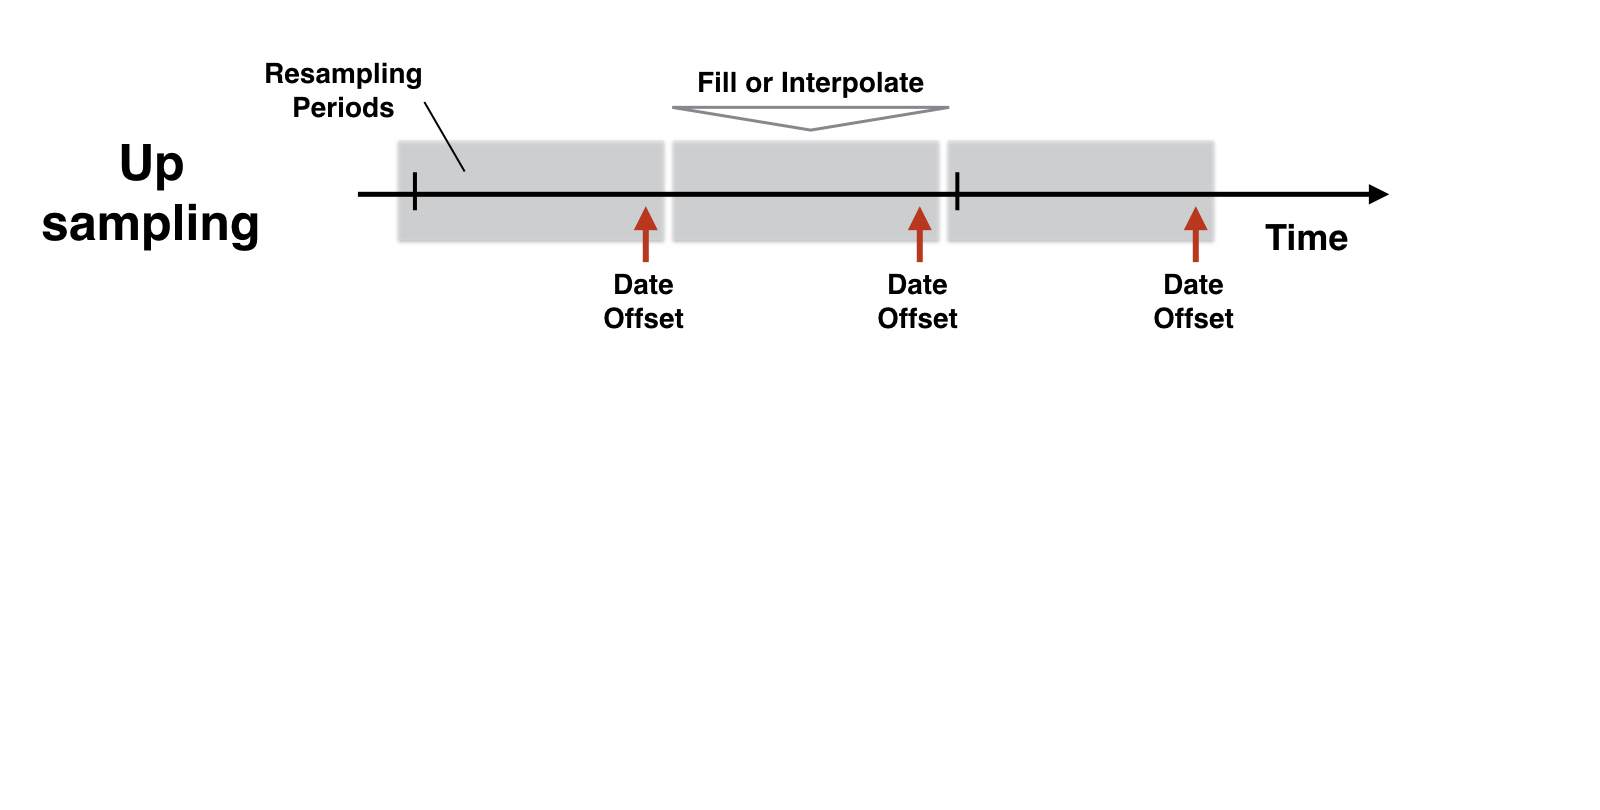
  • 업샘플링: 기존 값을 채우거나 보간

  • 다운샘플링: 기존 데이터에 집계 적용

Python으로 시계열 데이터 다루기

시작하기: 월별 실업률

unrate = pd.read_csv('unrate.csv', parse_dates['Date'], index_col='Date')

unrate.info()
DatetimeIndex: 208 entries, 2000-01-01 to 2017-04-01
Data columns (total 1 columns):
UNRATE    208 non-null float64 # no frequency information
dtypes: float64(1)
unrate.head()
            UNRATE
DATE
2000-01-01     4.0
2000-02-01     4.1
2000-03-01     4.0
2000-04-01     3.8
2000-05-01     4.0
  • 보고 날짜: 매월 1일
Python으로 시계열 데이터 다루기

리샘플링 기간 및 빈도 오프셋

  • Resample은 빈도 오프셋에 따라 새 날짜를 생성합니다
  • 월말 캘린더 외에도 다양한 대안이 있습니다


빈도 별칭 샘플 날짜
월말 (캘린더) M 2017-04-30
월초 (캘린더) MS 2017-04-01
월말 (영업일) BM 2017-04-28
월초 (영업일) BMS 2017-04-03
Python으로 시계열 데이터 다루기

리샘플링 로직

ch2_3_v2 - Upsampling & Interpolation.015.png

Python으로 시계열 데이터 다루기

리샘플링 로직

ch2_3_v2 - Upsampling & Interpolation.016.png

Python으로 시계열 데이터 다루기

.resample()로 빈도 지정

unrate.asfreq('MS').info()
DatetimeIndex: 208 entries, 2000-01-01 to 2017-04-01
Freq: MS
Data columns (total 1 columns):
UNRATE    208 non-null float64
dtypes: float64(1)
unrate.resample('MS') # creates Resampler object
DatetimeIndexResampler [freq=<MonthBegin>, axis=0, closed=left, 
                        label=left, convention=start, base=0]
Python으로 시계열 데이터 다루기

.resample()로 빈도 지정

unrate.asfreq('MS').equals(unrate.resample('MS').asfreq())
True
  • .resample(): 다른 메서드를 호출할 때만 데이터를 반환
Python으로 시계열 데이터 다루기

분기별 실질 GDP 성장률

gdp = pd.read_csv('gdp.csv')

gdp.info()
DatetimeIndex: 69 entries, 2000-01-01 to 2017-01-01
Data columns (total 1 columns):
gpd    69 non-null float64 # no frequency info
dtypes: float64(1)
gdp.head(2)
            gpd
DATE
2000-01-01  1.2
2000-04-01  7.8
Python으로 시계열 데이터 다루기

월별 실질 GDP 성장률 보간

gdp_1 = gdp.resample('MS').ffill().add_suffix('_ffill')
       gpd_ffill
DATE
2000-01-01  1.2
2000-02-01  1.2
2000-03-01  1.2
2000-04-01  7.8
Python으로 시계열 데이터 다루기

월별 실질 GDP 성장률 보간

gdp_2 = gdp.resample('MS').interpolate().add_suffix('_inter')
            gpd_inter
DATE
2000-01-01  1.200000
2000-02-01  3.400000
2000-03-01  5.600000
2000-04-01  7.800000
  • .interpolate(): 기존 데이터 사이를 직선으로 연결해 값을 추정
Python으로 시계열 데이터 다루기

두 DataFrame 연결하기

df1 = pd.DataFrame([1, 2, 3], columns=['df1'])

df2 = pd.DataFrame([4, 5, 6], columns=['df2'])
pd.concat([df1, df2])
   df1  df2
0  1.0  NaN
1  2.0  NaN
2  3.0  NaN
0  NaN  4.0
1  NaN  5.0
2  NaN  6.0
Python으로 시계열 데이터 다루기

두 DataFrame 연결하기

pd.concat([df1, df2], axis=1)
   df1  df2
0    1    4
1    2    5
2    3    6
  • axis=1: 수평 방향으로 연결
Python으로 시계열 데이터 다루기

보간된 실질 GDP 성장률 시각화

pd.concat([gdp_1, gdp_2], axis=1).loc['2015':].plot()
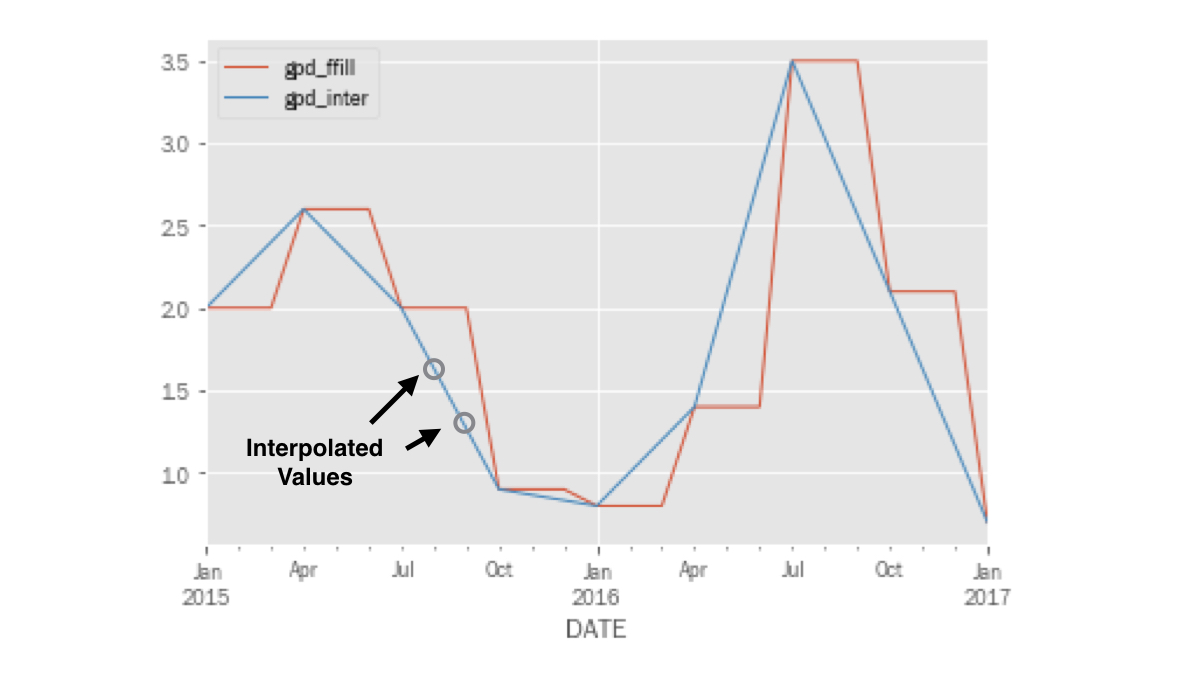
ch2_3_v2 - Upsampling & Interpolation.032.png

Python으로 시계열 데이터 다루기

GDP 성장률과 실업률 결합

pd.concat([unrate, gdp_inter], axis=1).plot();
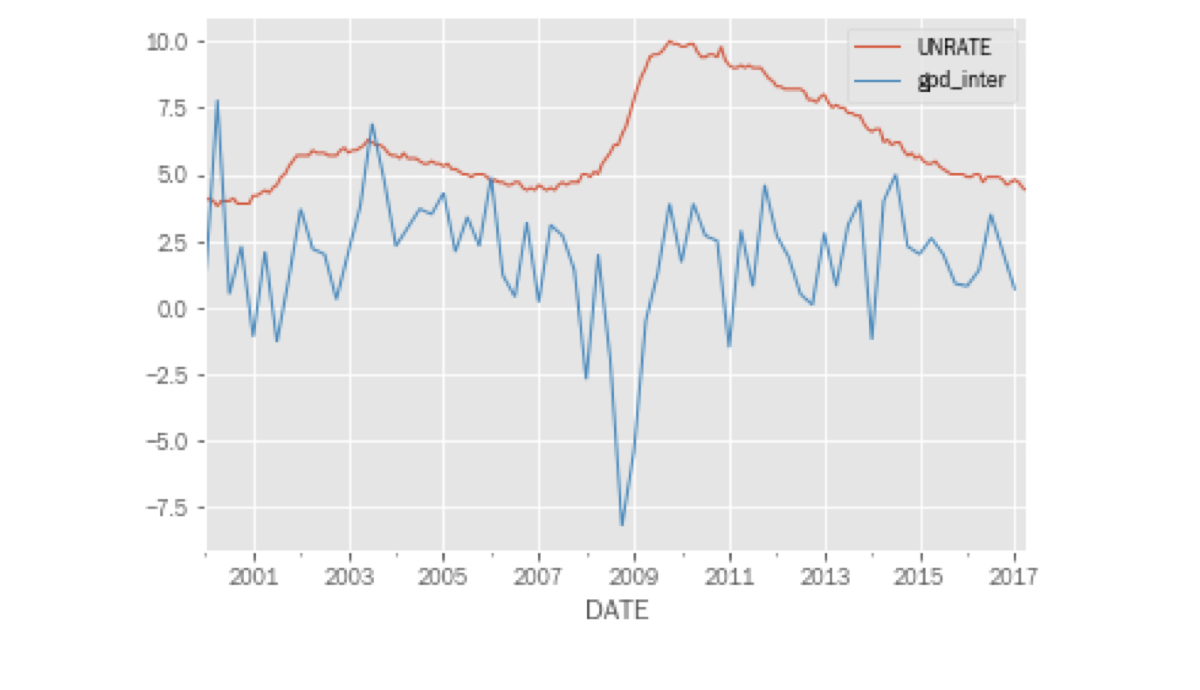
ch2_3_v2 - Upsampling & Interpolation.034.png

Python으로 시계열 데이터 다루기

연습해 봅시다!

Python으로 시계열 데이터 다루기

Preparing Video For Download...