pandas 확장 윈도우 함수

Python으로 시계열 데이터 다루기

Stefan Jansen

Founder & Lead Data Scientist at Applied Artificial Intelligence

pandas의 확장 윈도우

  • 롤링 윈도우에서 확장 윈도우로
  • 현재 날짜까지의 기간에 대한 지표 계산
  • 새 시계열은 모든 과거 값을 반영
  • 누적 수익률, 누적 최솟값/최댓값 계산에 유용
  • pandas에서 두 가지 방법 제공:
    • .expanding() - .rolling()과 동일한 방식
    • .cumsum(), .cumprod(), cummin()/max()
Python으로 시계열 데이터 다루기

기본 개념

df = pd.DataFrame({'data': range(5)})

df['expanding sum'] = df.data.expanding().sum()
df['cumulative sum'] = df.data.cumsum()
df
   data  expanding sum  cumulative sum
0     0            0.0               0
1     1            1.0               1
2     2            3.0               3
3     3            6.0               6
4     4           10.0              10
Python으로 시계열 데이터 다루기

S&P 500 데이터 불러오기

data = pd.read_csv('sp500.csv', parse_dates=['date'], index_col='date')
DatetimeIndex: 2519 entries, 2007-05-24 to 2017-05-24
Data columns (total 1 columns):
SP500    2519 non-null float64
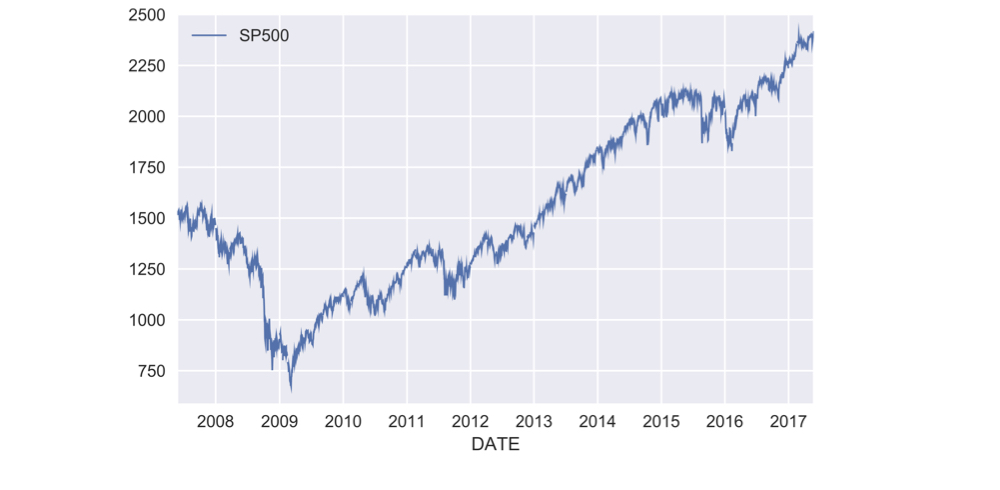
ch3_2_v2 - Expanding Window Functions with Pandas.013.png

Python으로 시계열 데이터 다루기

누적 수익률 계산 방법

  • 단일 기간 수익률 $r_t$: 현재 가격을 이전 가격으로 나눈 후 1을 뺀 값:

    $$r_t = \frac{P_t}{P_{t-1}} - 1$$

    • 다중 기간 수익률: 각 기간의 $(1 + r_t)$를 곱한 후 1을 뺀 값:

    $$R_T = (1 + r_1)(1 + r_2)...(1 + r_T) - 1$$

    • 기간 수익률 계산: .pct_change()
    • 기본 연산: .add(), .sub(), .mul(), .div()
    • 누적 곱 계산: .cumprod()
Python으로 시계열 데이터 다루기

누적 수익률 실습

pr = data.SP500.pct_change() # period return

pr_plus_one = pr.add(1)
cumulative_return = pr_plus_one.cumprod().sub(1)
cumulative_return.mul(100).plot()

ch3_2_v2 - Expanding Window Functions with Pandas.021.png

Python으로 시계열 데이터 다루기

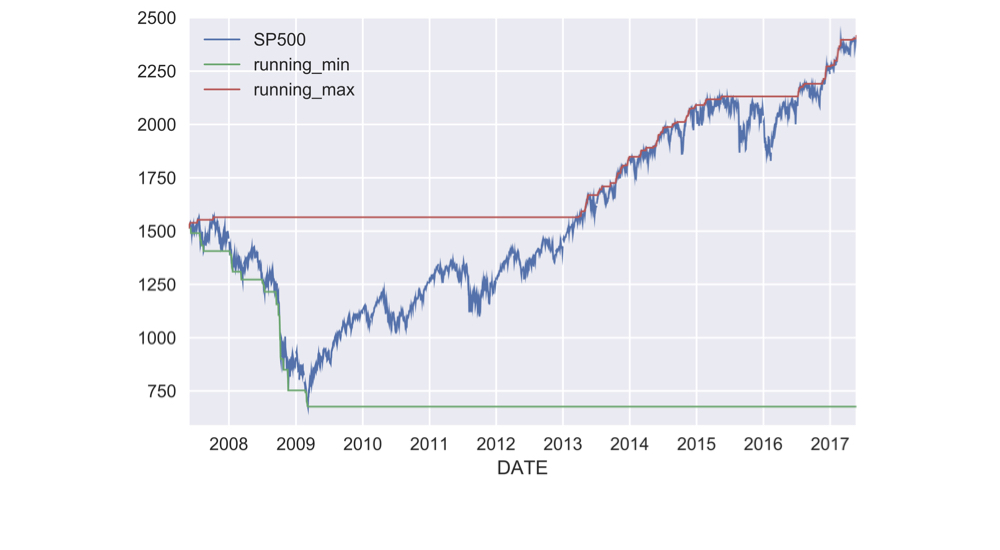
누적 최솟값 & 최댓값 구하기

data['running_min'] = data.SP500.expanding().min()

data['running_max'] = data.SP500.expanding().max()
data.plot()

ch3_2_v2 - Expanding Window Functions with Pandas.023.png

Python으로 시계열 데이터 다루기

롤링 연간 수익률

def multi_period_return(period_returns):
    return np.prod(period_returns + 1) - 1

pr = data.SP500.pct_change() # period return
r = pr.rolling('360D').apply(multi_period_return)
data['Rolling 1yr Return'] = r.mul(100)
data.plot(subplots=True)
Python으로 시계열 데이터 다루기

롤링 연간 수익률

data['Rolling 1yr Return'] = r.mul(100)

data.plot(subplots=True)

ch3_2_v2 - Expanding Window Functions with Pandas.027.png

Python으로 시계열 데이터 다루기

연습해 봅시다!

Python으로 시계열 데이터 다루기

Preparing Video For Download...