Python으로 시계열 데이터 다루기
Stefan Jansen
Founder & Lead Data Scientist at Applied Artificial Intelligence
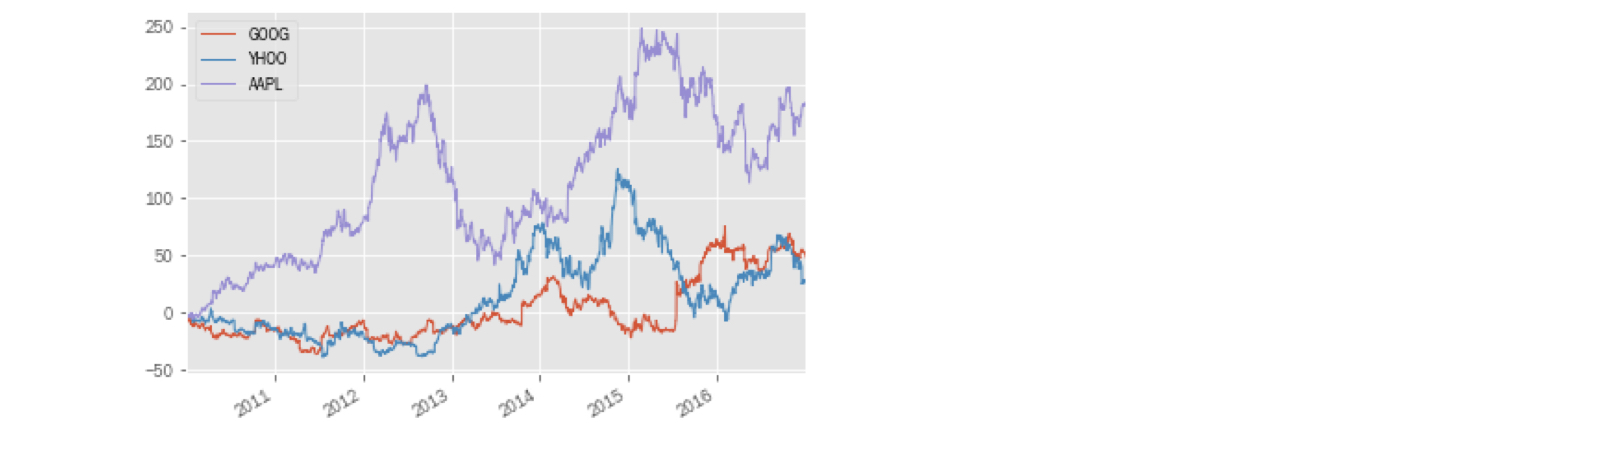
주가 시계열: 수준이 달라 비교가 어려움
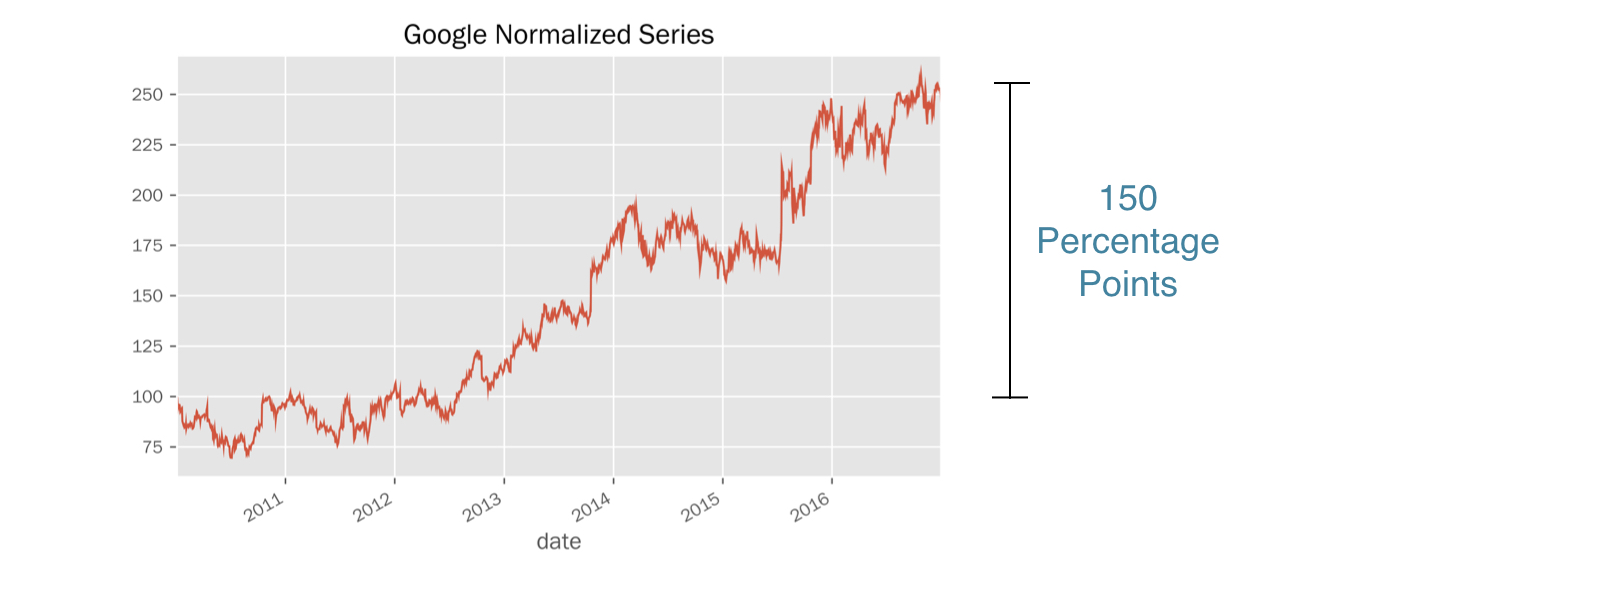
간단한 해결책: 가격 시계열을 100으로 정규화
모든 가격을 첫 번째 값으로 나누고 100을 곱함
동일한 시작점
모든 가격이 시작점 기준 상대값
시작점과의 차이를 퍼센트포인트로 표현
google = pd.read_csv('google.csv', parse_dates=['date'], index_col='date')google.head(3)
price
date
2010-01-04 313.06
2010-01-05 311.68
2010-01-06 303.83
first_price = google.price.iloc[0] # int-based selectionfirst_price
313.06
first_price == google.loc['2010-01-04', 'price']
True
normalized = google.price.div(first_price).mul(100)normalized.plot(title='Google Normalized Series')
prices = pd.read_csv('stock_prices.csv', parse_dates=['date'], index_col='date')prices.info()
DatetimeIndex: 1761 entries, 2010-01-04 to 2016-12-30
Data columns (total 3 columns):
AAPL 1761 non-null float64
GOOG 1761 non-null float64
YHOO 1761 non-null float64
dtypes: float64(3)
prices.head(2)
AAPL GOOG YHOO
Date
2010-01-04 30.57 313.06 17.10
2010-01-05 30.63 311.68 17.23
prices.iloc[0]
AAPL 30.57
GOOG 313.06
YHOO 17.10
Name: 2010-01-04 00:00:00, dtype: float64
normalized = prices.div(prices.iloc[0])normalized.head(3)
AAPL GOOG YHOO
Date
2010-01-04 1.000000 1.000000 1.000000
2010-01-05 1.001963 0.995592 1.007602
2010-01-06 0.985934 0.970517 1.004094
.div(): Series 인덱스와 DataFrame 열을 자동으로 정렬index = pd.read_csv('benchmark.csv', parse_dates=['date'], index_col='date')index.info()
DatetimeIndex: 1826 entries, 2010-01-01 to 2016-12-30
Data columns (total 1 columns):
SP500 1762 non-null float64
dtypes: float64(1)
prices = pd.concat([prices, index], axis=1).dropna()prices.info()
DatetimeIndex: 1761 entries, 2010-01-04 to 2016-12-30
Data columns (total 4 columns):
AAPL 1761 non-null float64
GOOG 1761 non-null float64
YHOO 1761 non-null float64
SP500 1761 non-null float64
dtypes: float64(4)
prices.head(1)
AAPL GOOG YHOO SP500
2010-01-04 30.57 313.06 17.10 1132.99
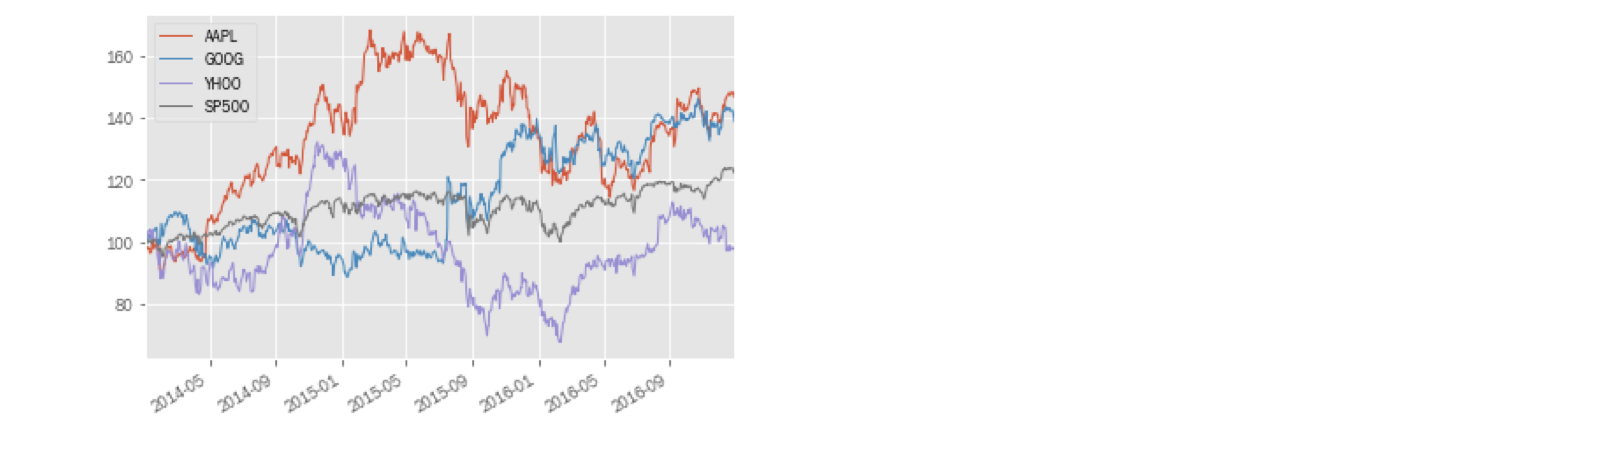
normalized = prices.div(prices.iloc[0]).mul(100)normalized.plot()
diff = normalized[tickers].sub(normalized['SP500'], axis=0)
GOOG YHOO AAPL
2010-01-04 0.000000 0.000000 0.000000
2010-01-05 -0.752375 0.448669 -0.115294
2010-01-06 -3.314604 0.043069 -1.772895
.sub(..., axis=0): 인덱스를 정렬하여 DataFrame 각 열에서 Series를 뺌diff.plot()

Python으로 시계열 데이터 다루기