Python ile Zaman Serisi Verilerini Görselleştirme
Thomas Vincent
Head of Data Science, Getty Images
plt takma adıyla içe aktarılırimport matplotlib.pyplot as plt

import matplotlib.pyplot as plt
import pandas as pd
df = df.set_index('date_column')
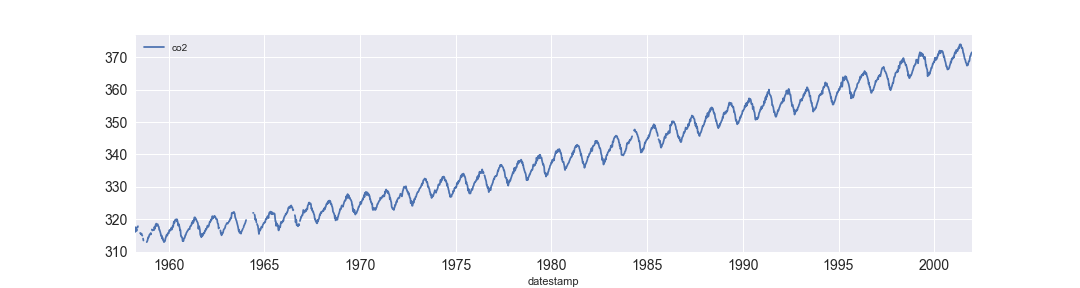
df.plot()
plt.show()
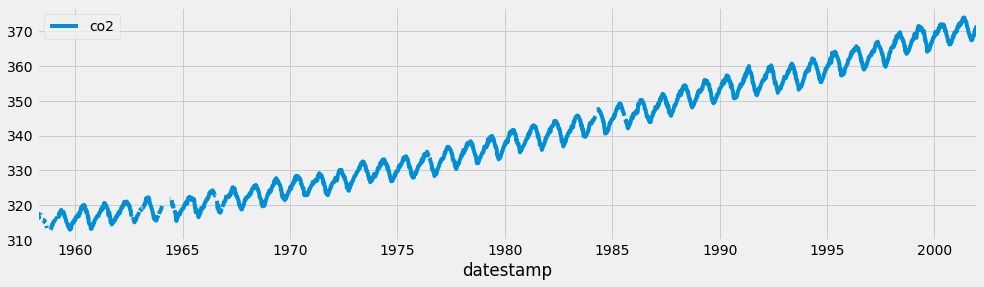
plt.style.use('fivethirtyeight')
df.plot()
plt.show()

print(plt.style.available)
['seaborn-dark-palette', 'seaborn-darkgrid',
'"seaborn-dark"', 'seaborn-notebook',
'seaborn-pastel', 'seaborn-white',
'classic', 'ggplot', 'grayscale',
'dark_background', 'seaborn-poster',
'seaborn-muted', 'seaborn', 'bmh',
'seaborn-paper', 'seaborn-whitegrid',
'seaborn-bright', 'seaborn-talk',
'fivethirtyeight', 'seaborn-colorblind',
'seaborn-deep', 'seaborn-ticks']
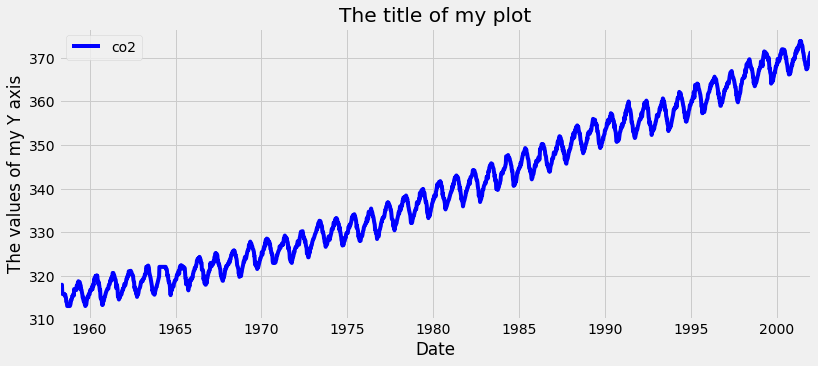
ax = df.plot(color='blue')
ax.set_xlabel('Date')
ax.set_ylabel('The values of my Y axis')
ax.set_title('The title of my plot')
plt.show()

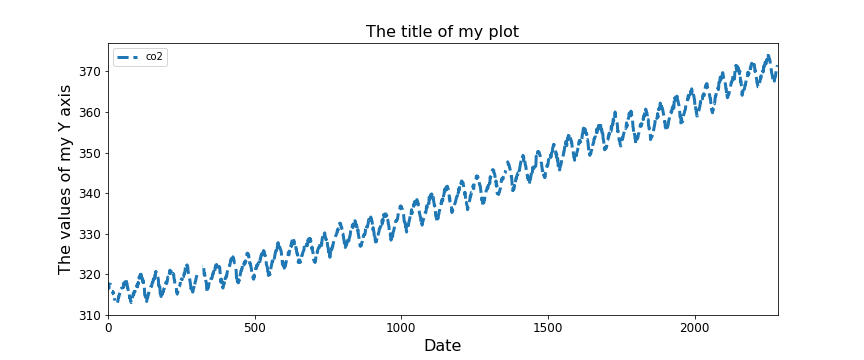
ax = df.plot(figsize=(12, 5), fontsize=12,
linewidth=3, linestyle='--')
ax.set_xlabel('Date', fontsize=16)
ax.set_ylabel('The values of my Y axis', fontsize=16)
ax.set_title('The title of my plot', fontsize=16)
plt.show()

Python ile Zaman Serisi Verilerini Görselleştirme