Koroplet nedir?

Python ile Coğrafi Verileri Görselleştirme

Mary van Valkenburg

Data Science Program Manager, Nashville Software School

Koropletin tanımı
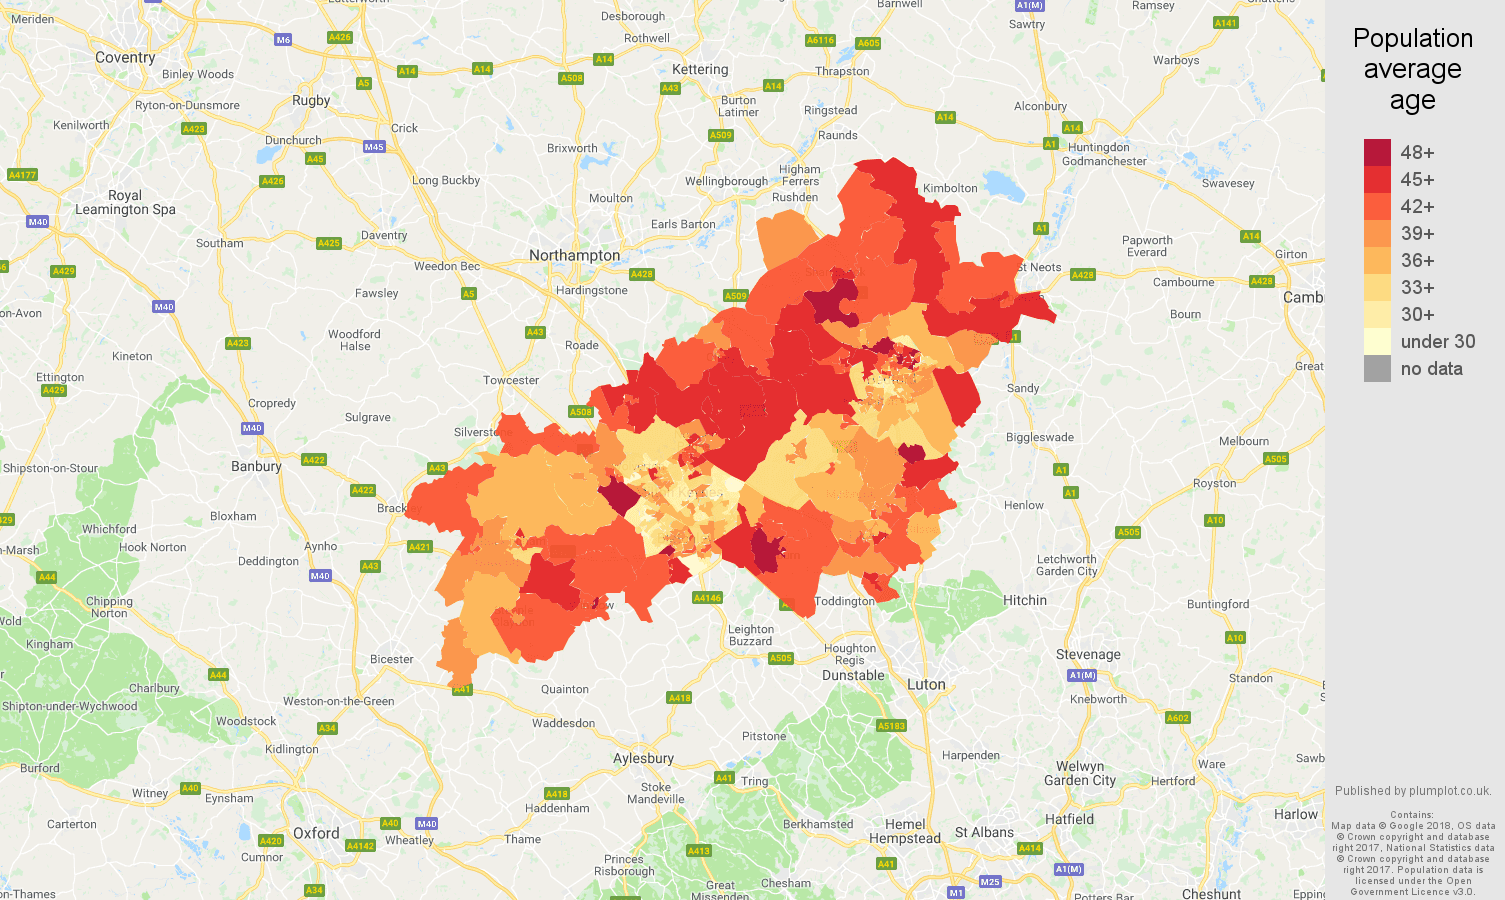
Milton Keynes'te LSOA'lara göre ortalama ikamet yaşı koropleti

Python ile Coğrafi Verileri Görselleştirme

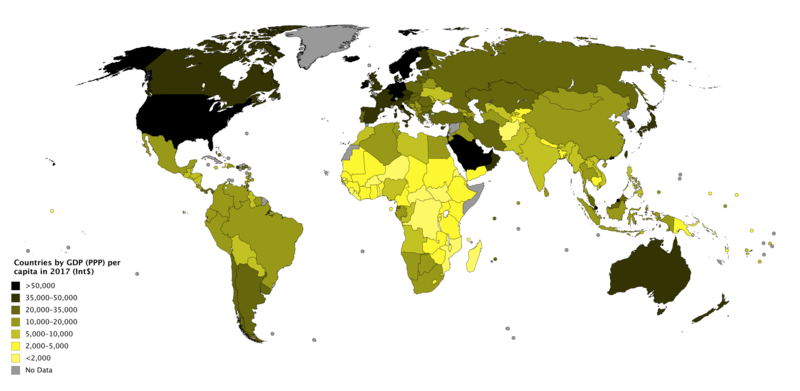
kişi başına GSYİH (SAGP) koropleti

Python ile Coğrafi Verileri Görselleştirme

Yoğunluk

schools_in_districts.head(2)
district  geometry                  name               lat    lng
1         (POLYGON ((-86.77 36.38... Nashville Prep    36.16 -86.85
1         (POLYGON ((-86.77 36.38... Rocketship Prep   36.17 -86.79
Python ile Coğrafi Verileri Görselleştirme

Sayıları al

school_counts = schools_in_districts.groupby(['district']).size()
print(school_counts)
district
1    30
2    11
3    19
4    18
5    36
6    21
7    13
8    10
9    12
dtype: int64
Python ile Coğrafi Verileri Görselleştirme

Sayıları ekle

school_counts_df = school_counts.to_frame()
school_counts_df = school_counts_df.reset_index()
school_counts_df.columns = ['district', 'school_count']
districts_with_counts = pd.merge(school_districts, school_counts_df, 
                                 on = 'district')
districts_with_counts.head(2)
district geometry           school_count
1        (POLYGON ((-86.77 36.38...  30
3        (POLYGON ((-86.75 36.40...  19
Python ile Coğrafi Verileri Görselleştirme

Sayıları alanlara böl

districts_with_counts['area'] = districts_with_counts.area
districts_with_counts['school_density'] = districts_with_counts.apply(
    lambda row: row.school_count/row.area, axis = 1)

districts_with_counts.head(2)
district geometry           school_count   area    school_density
1        (POLYGON ((-86.77 36.38...    30    0.036641    818.745403
3        (POLYGON ((-86.75 36.40...    19    0.014205    1337.594495
Python ile Coğrafi Verileri Görselleştirme

Hadi pratik yapalım!

Python ile Coğrafi Verileri Görselleştirme

Preparing Video For Download...