Log Insights และการวิเคราะห์
การติดตามและแก้ไขปัญหาบน AWS

John Q. Martin
Principal Consultant
โครงสร้างคิวรีของ Logs Insights
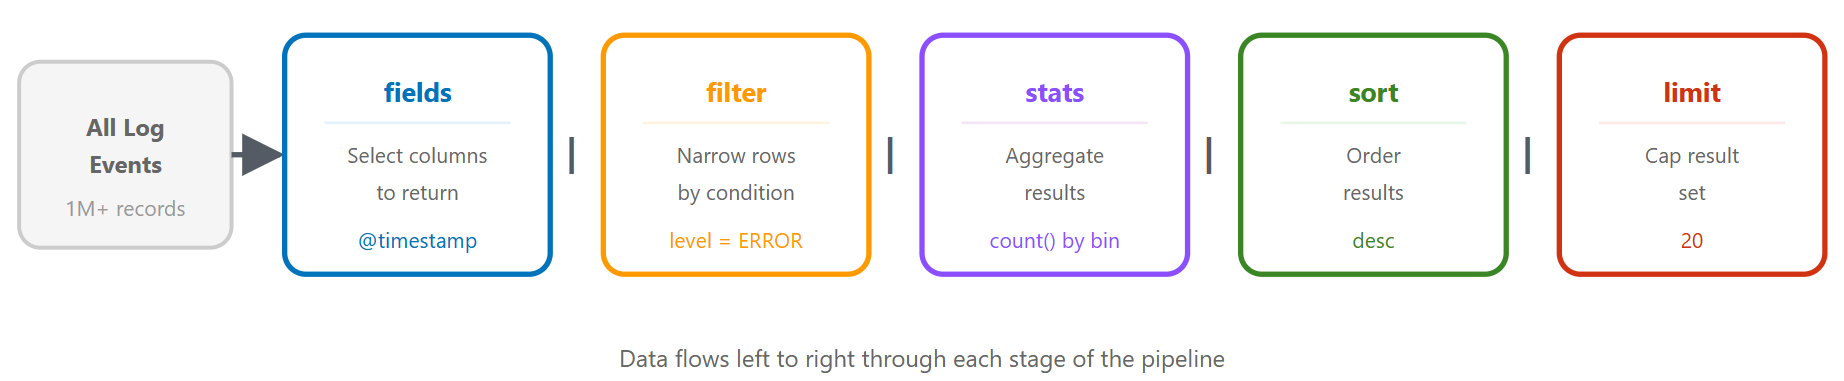
ภาษาคิวรี: คิวรีเดียวกัน สามวิธี
CloudWatch Logs Insights QL
fields @timestamp, @message, level
| filter level = "ERROR"
| filter @timestamp > ago(1h)
| sort @timestamp desc
| limit 20
OpenSearch PPL
source = `/aws/lambda/my-function`
| where level = 'ERROR' and @timestamp > ago(1h)
| fields @timestamp, @message, level
| sort - @timestamp
| head 20
ภาษาคิวรี: OpenSearch SQL
OpenSearch SQL
SELECT `@timestamp`, `@message`, level
FROM `/aws/lambda/my-function`
WHERE level = 'ERROR'
  AND `@timestamp` > ago(1h)
ORDER BY `@timestamp` DESC
LIMIT 20
- ใช้ไวยากรณ์ SELECT / FROM / WHERE มาตรฐาน
- รองรับ JOIN ข้าม log group
- เลือกแบบที่เหมาะกับทีม
สถานการณ์ที่ 1: ตรวจหา error spike
fields @timestamp, @message, level
| filter level = "ERROR"
| stats count() as error_count by bin(5m)
| sort @timestamp desc
ขั้นสูง: จัดกลุ่มตามประเภทข้อผิดพลาด
fields @timestamp, error_type, error_message
| filter level = "ERROR"
| stats count() as count by error_type, bin(5m)
| sort count desc
สถานการณ์ที่ 2: API endpoint ที่ช้า
fields @timestamp, endpoint, response_time, status_code
| filter response_time > 1000
| stats avg(response_time) as avg_time,
        max(response_time) as max_time,
        count() as slow_requests
        by endpoint
| sort avg_time desc
เจาะลึก
fields @timestamp, endpoint, response_time, user_id, request_id
| filter endpoint = "/api/users" and response_time > 1000
| sort response_time desc
| limit 20
สถานการณ์ที่ 3: การยืนยันตัวตนที่ล้มเหลว
fields @timestamp, user_id, ip_address, action
| filter action = "login_failed"
| stats count() as failed_attempts by user_id, ip_address
| sort failed_attempts desc
| limit 50
วิเคราะห์ตามช่วงเวลา
fields @timestamp, user_id, ip_address
| filter action = "login_failed"
| stats count() as attempts by ip_address, bin(1h)
| filter attempts > 10
| sort attempts desc
สถานการณ์ที่ 4 & 5: Database timeout และ memory leak
Database timeout
fields @timestamp, @message
| filter @message like /database/ and @message like /timeout|error|failed/
| parse @message "timeout after * seconds" as timeout_duration
| stats count() as timeout_count,
        avg(timeout_duration) as avg_timeout
        by bin(5m)
ตรวจจับ memory leak
fields @timestamp, memory_used_mb, heap_size_mb
| stats avg(memory_used_mb) as avg_memory,
        max(memory_used_mb) as max_memory
        by bin(1h)
| sort @timestamp asc
สถานการณ์ที่ 6: การติดตาม request
fields @timestamp, @message, request_id, service, action
| filter request_id = "abc123def456"
| sort @timestamp asc
ติดตามแบบหลาย service
fields @timestamp, service, action, duration_ms, status
| filter request_id = "abc123def456"
| sort @timestamp asc
| display @timestamp, service, action, duration_ms, status
เทคนิคขั้นสูง: parse และ Regex
แยกวิเคราะห์ log ที่ไม่มีโครงสร้าง
fields @timestamp, @message
| parse @message "[*] User * failed to access resource * from IP *"
    as level, user, resource, ip
การแยกวิเคราะห์ด้วย Regex
| parse @message /Request completed in (?<duration>\d+)ms with status (?<status>\d+)/
เทคนิคขั้นสูง: Calculated Fields
fields @timestamp, requests, errors
| fields error_rate = (errors / requests) * 100

fields @timestamp, status_code
| fields status_category =
    case(status_code < 300, "success",
         status_code < 500, "client_error",
         status_code >= 500, "server_error")
| stats count() as request_count by status_category
การปรับแต่งคิวรี
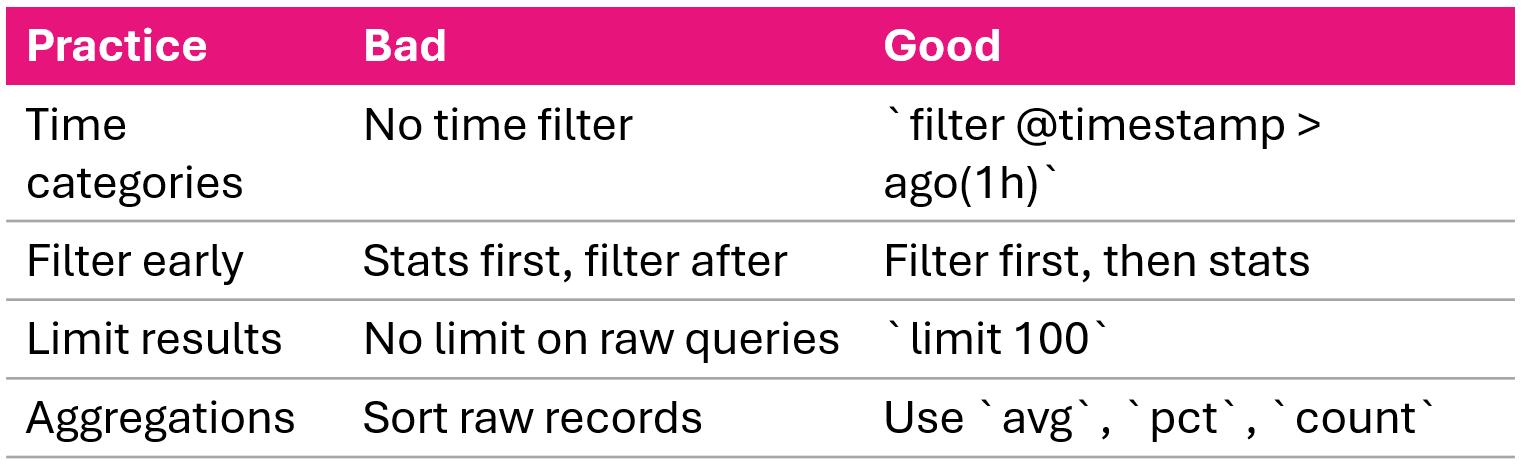
การตรวจจับ anomaly และความสัมพันธ์
การตรวจจับ anomaly เชิงสถิติ
- คำนวณ baseline: avg และ stddev ย้อนหลัง 7 วัน
- เปรียบเทียบช่วงปัจจุบันกับ baseline
- ทำเครื่องหมายค่าที่เกิน 2 standard deviation ว่าผิดปกติ
ความสัมพันธ์ของ error rate
fields @timestamp, level
| stats count() as total_requests,
        sum(case(level = "ERROR", 1, 0)) as errors
        by bin(5m)
| fields error_rate = (errors / total_requests) * 100
สรุป
- CloudWatch Logs Insights: บริการคิวรีเชิงโต้ตอบ ไม่ต้องจัดการ infrastructure
- ภาษาคิวรี 3 แบบ: Logs Insights QL, OpenSearch PPL, OpenSearch SQL
- สถานการณ์แก้ปัญหา 6 แบบ: error spike, endpoint ช้า, auth ล้มเหลว, DB timeout, memory leak, request tracing
- เทคนิคขั้นสูง:
parseสำหรับข้อความไม่มีโครงสร้าง,bin()สำหรับ time-series,pct()สำหรับ percentile - ความสัมพันธ์และการตรวจจับ anomaly: วิเคราะห์ error rate และเปรียบเทียบกับ baseline เชิงสถิติ
- จากการสืบสวนสู่การอัตโนมัติ: metric filter และ alarm ปิดวงจรการทำงาน
มาฝึกกันเถอะ!
การติดตามและแก้ไขปัญหาบน AWS

