Traces en servicemaps analyseren
Monitoring en troubleshooting van AWS

John Q. Martin
Principal Consultant
Wat is een servicemap?
Automatisch gegenereerd uit je trace-data: geen handmatige setup
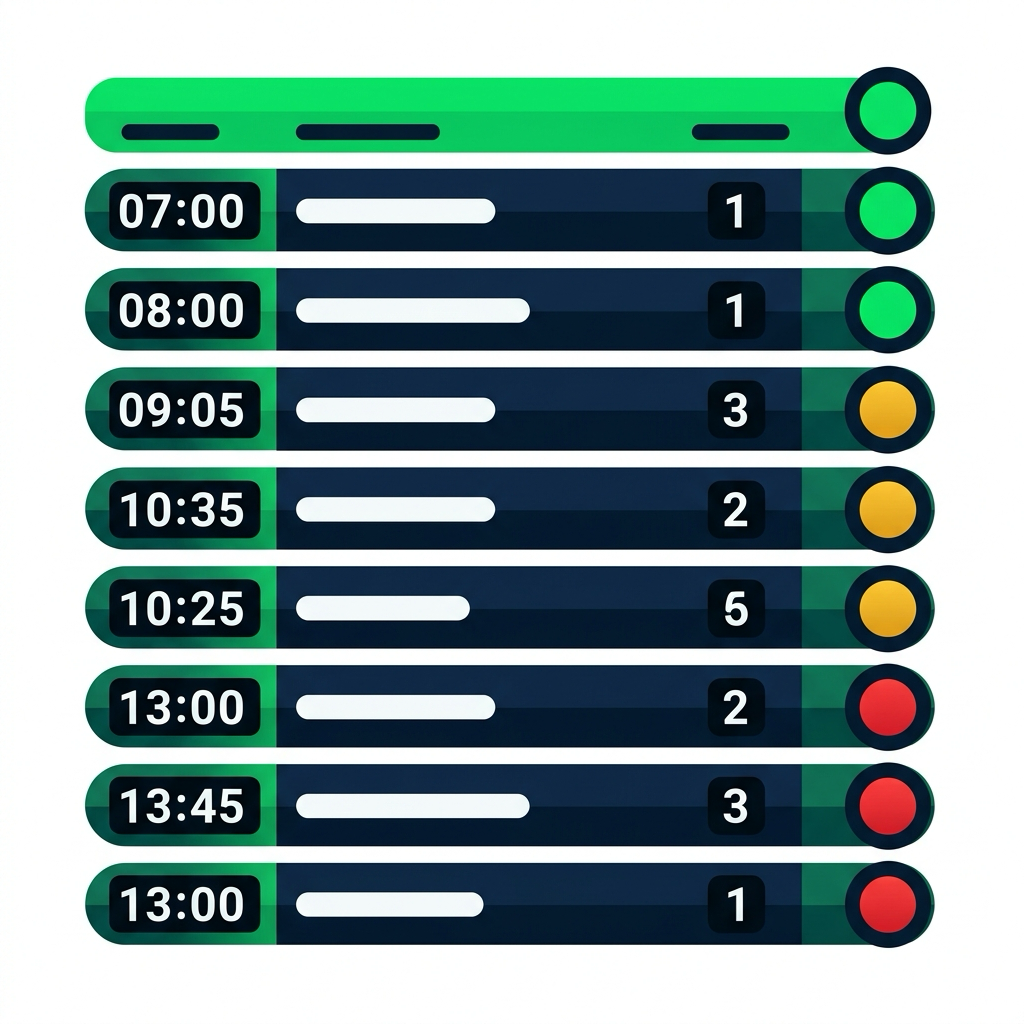
In één oogopslag: groen = op tijd · amber = vertraagd · rood = gestopt
Kleurcodering servicemap
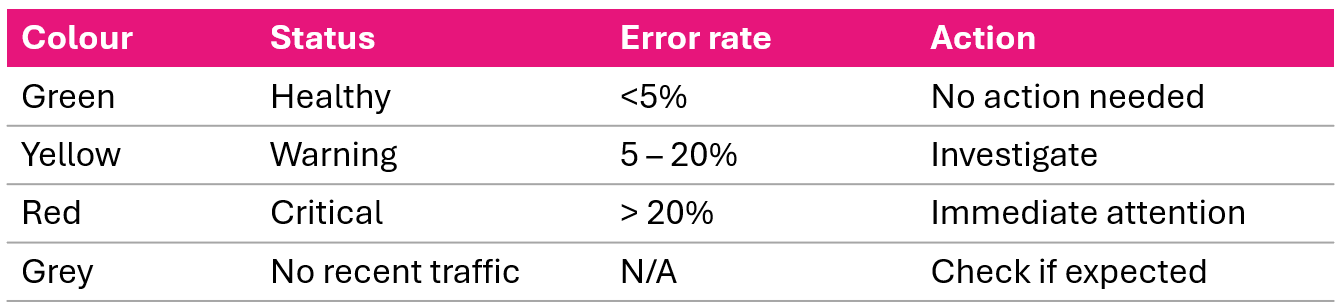
Als je een servicemap opent, ga direct naar alles wat niet groen is.
Klik op een node voor: verdeling van responstijden, uitsplitsing HTTP-status, fouttypes.
Een servicemap lezen
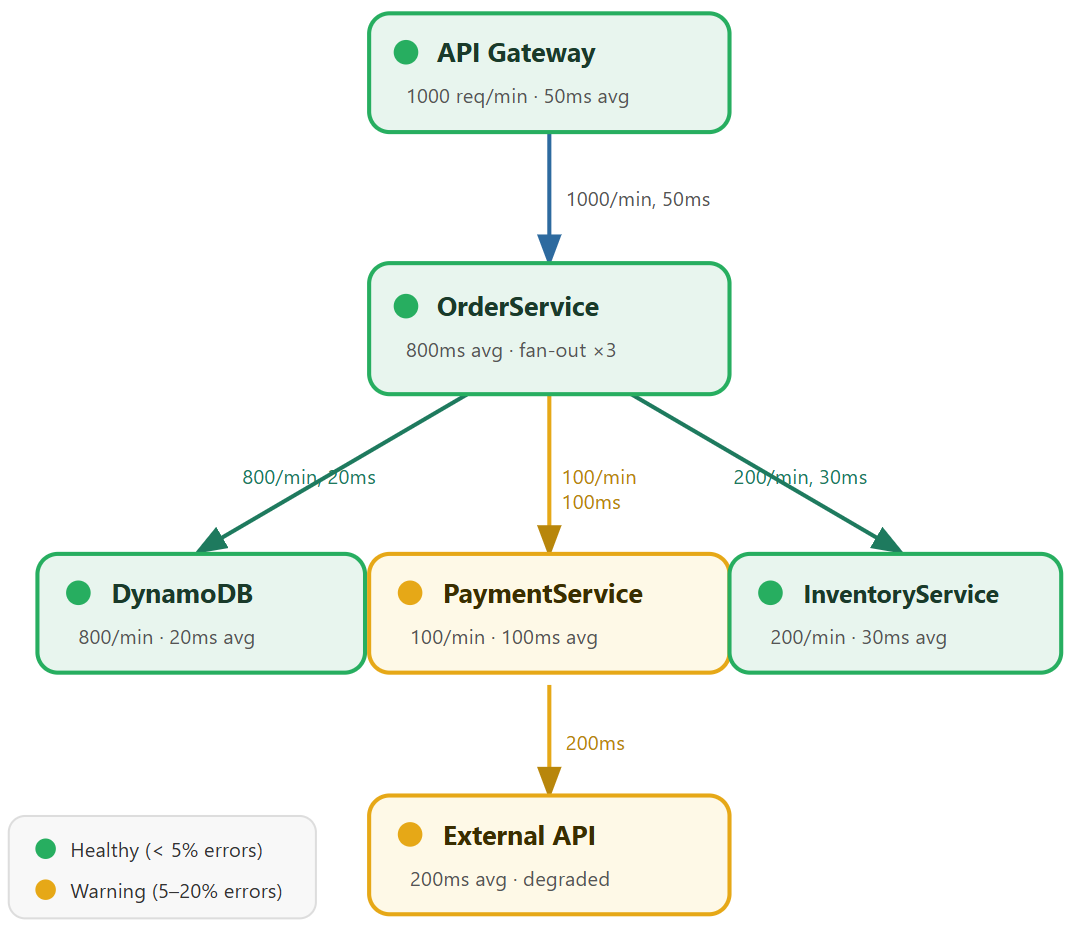
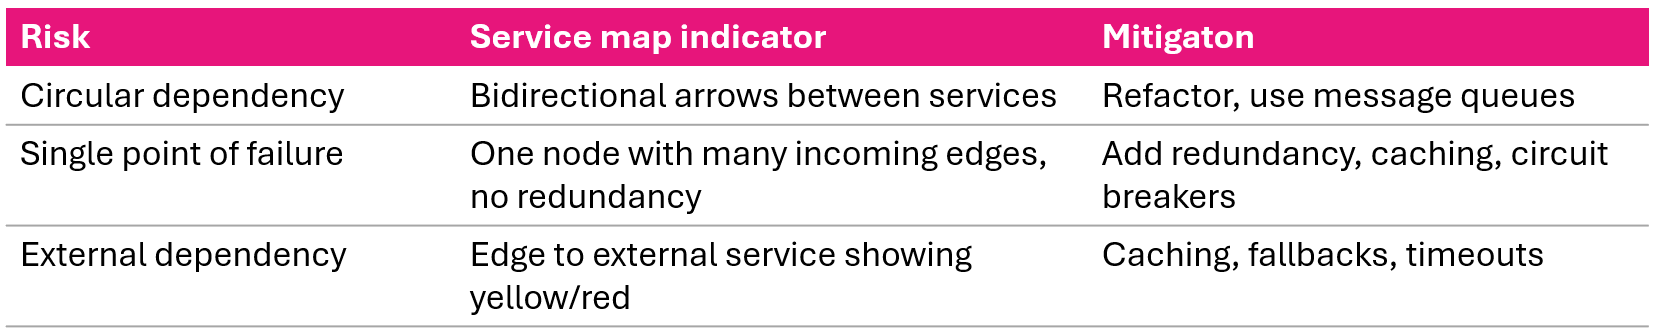
Afhankelijkheidsrisico's
Trace-tijdlijnen begrijpen
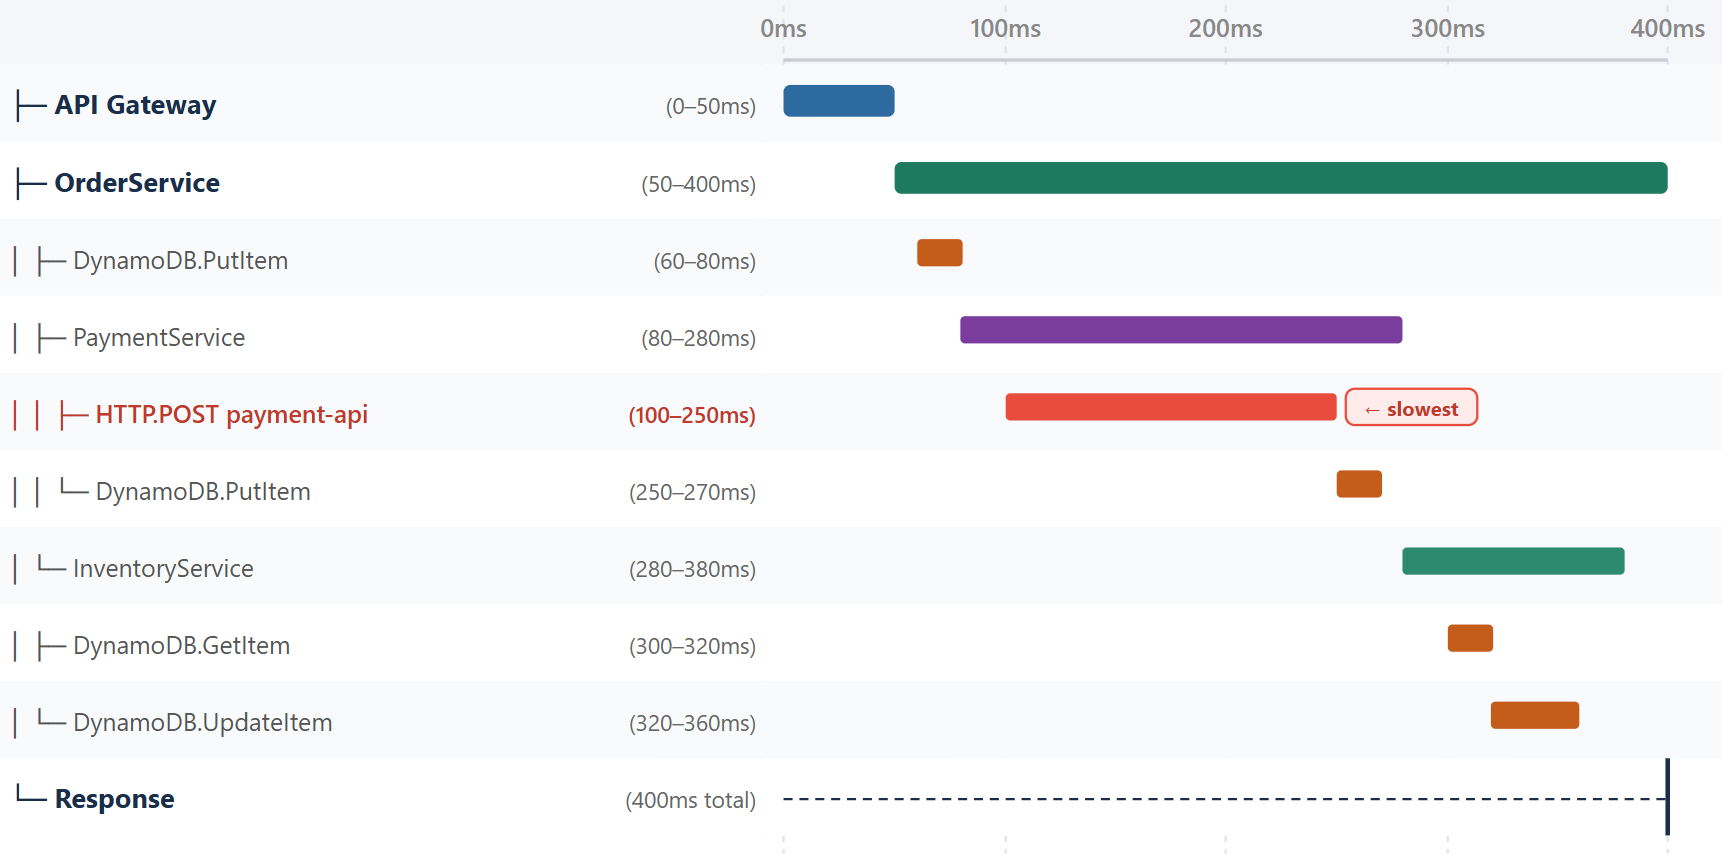
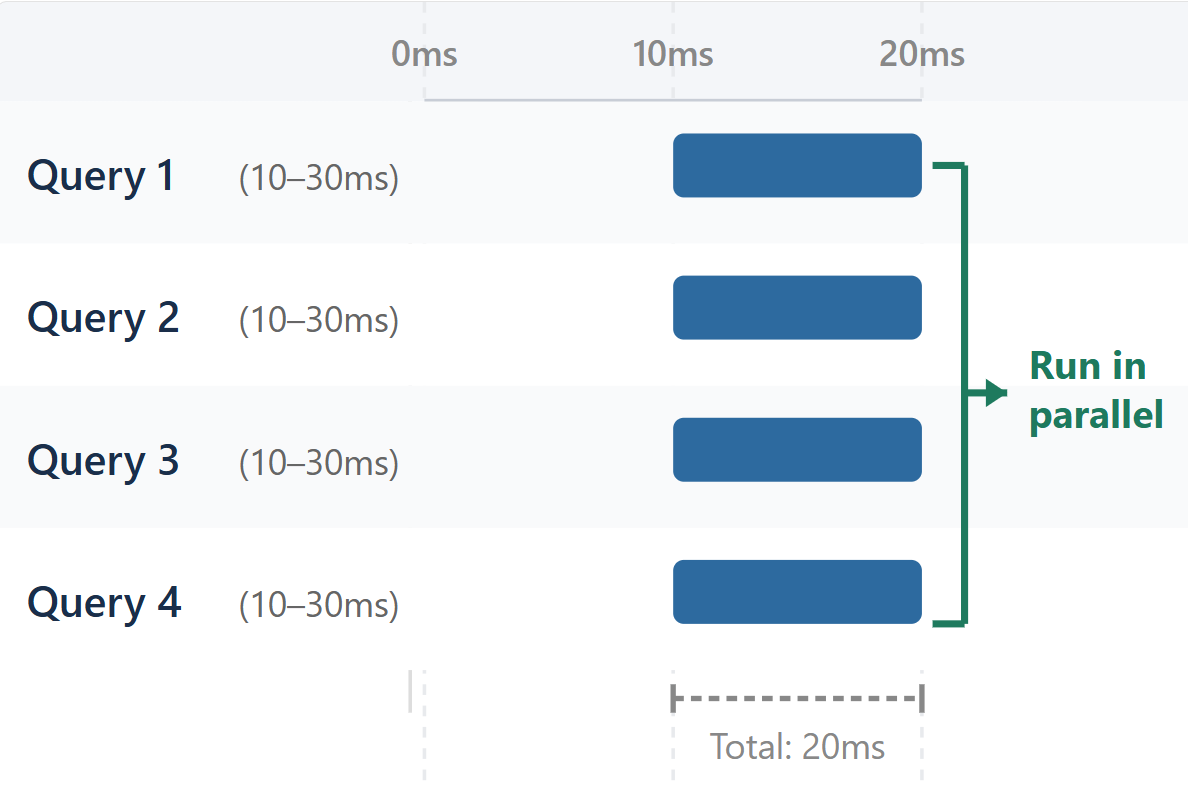
Patroon 1: Sequentiële bottlenecks
Na (parallel - 20ms):
Patroon 3: Cold starts en cascaderende fouten
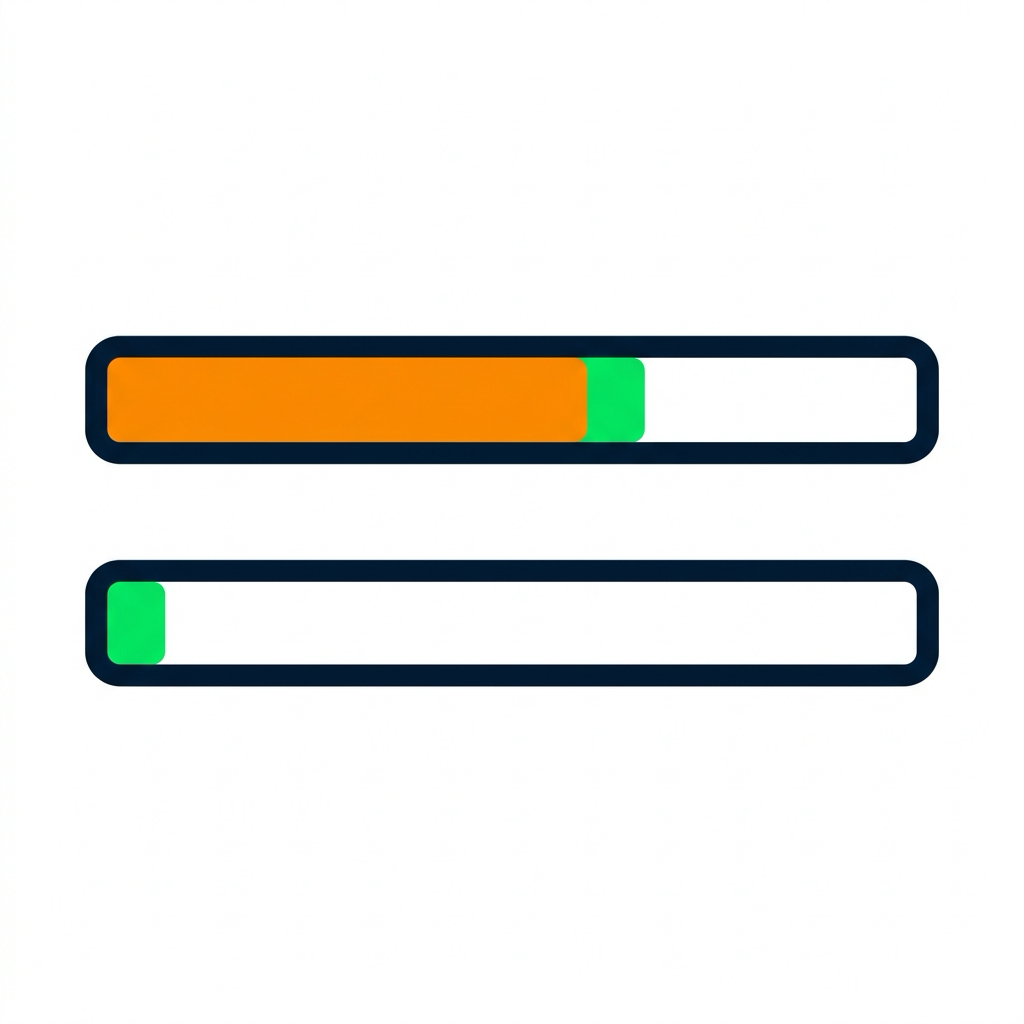
Lambda Cold Start:
- Cold: 3000ms (2500ms init + 500ms handler)
- Warm: 500ms (alleen handler)
- Zichtbaar als groot init-segment bij eerste aanroep
Oplossing: provisioned concurrency, initialisatie optimaliseren
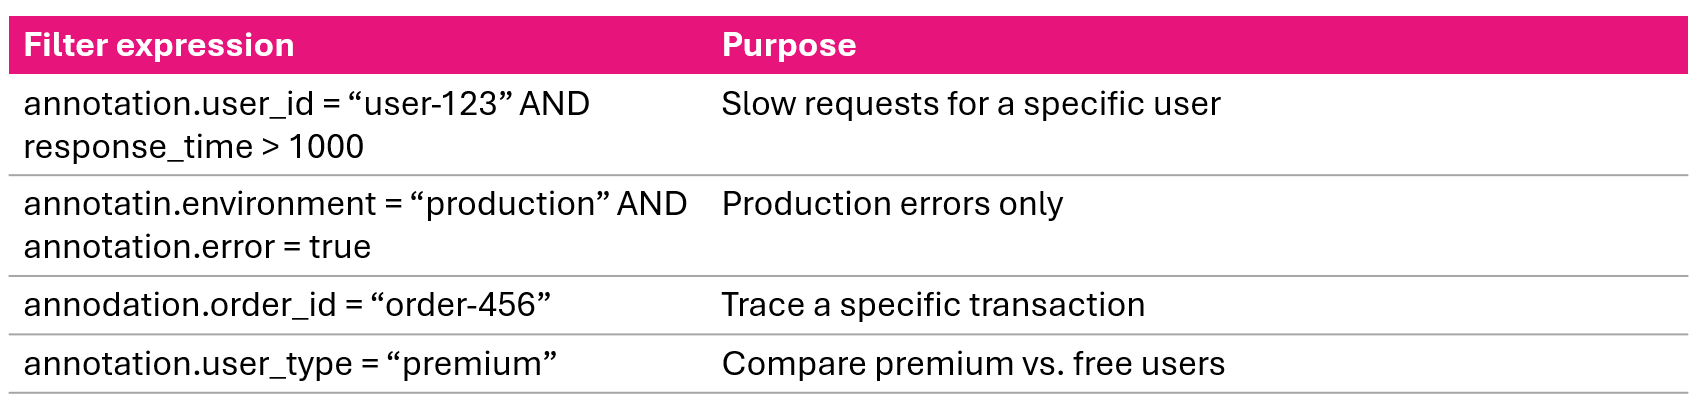
Traces filteren met annotations