Approfondimenti e analisi dei log
Monitoraggio e risoluzione dei problemi su AWS

John Q. Martin
Principal Consultant
Struttura delle query di Logs Insights
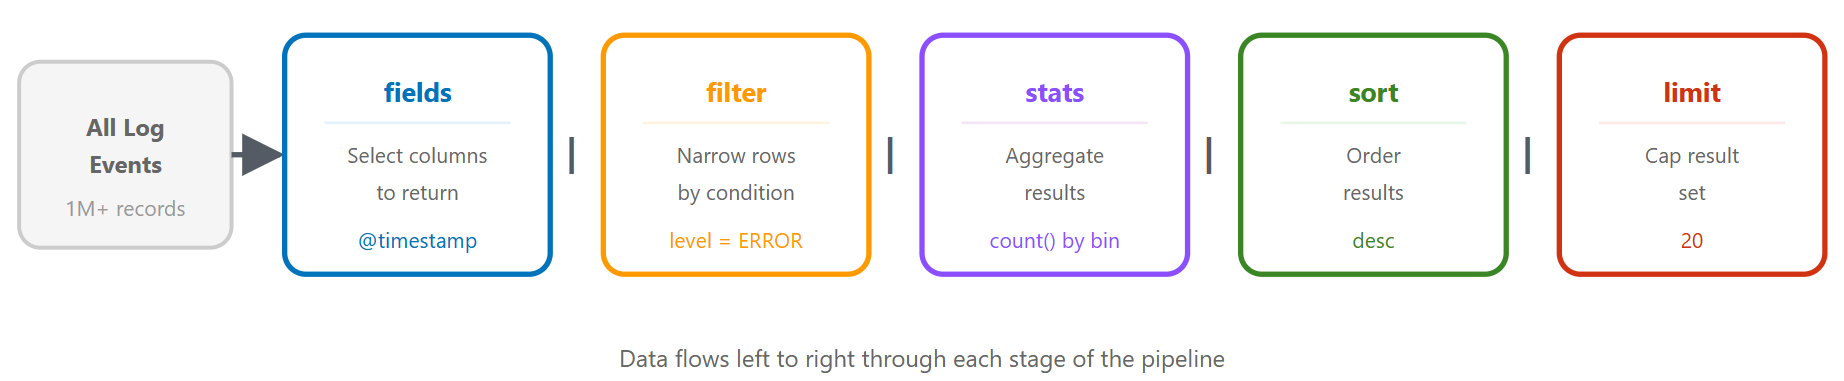
Linguaggi di query: stessa query, tre modi
CloudWatch Logs Insights QL
fields @timestamp, @message, level
| filter level = "ERROR"
| filter @timestamp > ago(1h)
| sort @timestamp desc
| limit 20
OpenSearch PPL
source = `/aws/lambda/my-function`
| where level = 'ERROR' and @timestamp > ago(1h)
| fields @timestamp, @message, level
| sort - @timestamp
| head 20
Linguaggi di query: OpenSearch SQL
OpenSearch SQL
SELECT `@timestamp`, `@message`, level
FROM `/aws/lambda/my-function`
WHERE level = 'ERROR'
  AND `@timestamp` > ago(1h)
ORDER BY `@timestamp` DESC
LIMIT 20
- Sintassi standard SELECT / FROM / WHERE
- Aggiunge JOIN tra gruppi di log
- Scegli quello che si adatta al tuo team
Scenario 1: Picchi di errori
fields @timestamp, @message, level
| filter level = "ERROR"
| stats count() as error_count by bin(5m)
| sort @timestamp desc
Migliorata: raggruppa per tipo di errore
fields @timestamp, error_type, error_message
| filter level = "ERROR"
| stats count() as count by error_type, bin(5m)
| sort count desc
Scenario 2: Endpoint API lenti
fields @timestamp, endpoint, response_time, status_code
| filter response_time > 1000
| stats avg(response_time) as avg_time,
        max(response_time) as max_time,
        count() as slow_requests
        by endpoint
| sort avg_time desc
Approfondimento
fields @timestamp, endpoint, response_time, user_id, request_id
| filter endpoint = "/api/users" and response_time > 1000
| sort response_time desc
| limit 20
Scenario 3: Autenticazioni non riuscite
fields @timestamp, user_id, ip_address, action
| filter action = "login_failed"
| stats count() as failed_attempts by user_id, ip_address
| sort failed_attempts desc
| limit 50
Analisi temporale
fields @timestamp, user_id, ip_address
| filter action = "login_failed"
| stats count() as attempts by ip_address, bin(1h)
| filter attempts > 10
| sort attempts desc
Scenari 4 e 5: Timeout DB e memory leak
Timeout del database
fields @timestamp, @message
| filter @message like /database/ and @message like /timeout|error|failed/
| parse @message "timeout after * seconds" as timeout_duration
| stats count() as timeout_count,
        avg(timeout_duration) as avg_timeout
        by bin(5m)
Rilevamento di memory leak
fields @timestamp, memory_used_mb, heap_size_mb
| stats avg(memory_used_mb) as avg_memory,
        max(memory_used_mb) as max_memory
        by bin(1h)
| sort @timestamp asc
Scenario 6: Tracciamento delle richieste
fields @timestamp, @message, request_id, service, action
| filter request_id = "abc123def456"
| sort @timestamp asc
Traccia multi-servizio
fields @timestamp, service, action, duration_ms, status
| filter request_id = "abc123def456"
| sort @timestamp asc
| display @timestamp, service, action, duration_ms, status
Tecniche avanzate: parse, Regex
Parsing di log non strutturati
fields @timestamp, @message
| parse @message "[*] User * failed to access resource * from IP *"
    as level, user, resource, ip
Parsing con Regex
| parse @message /Request completed in (?<duration>\d+)ms with status (?<status>\d+)/
Tecniche avanzate: campi calcolati
fields @timestamp, requests, errors
| fields error_rate = (errors / requests) * 100

fields @timestamp, status_code
| fields status_category =
    case(status_code < 300, "success",
         status_code < 500, "client_error",
         status_code >= 500, "server_error")
| stats count() as request_count by status_category
Ottimizzazione delle query
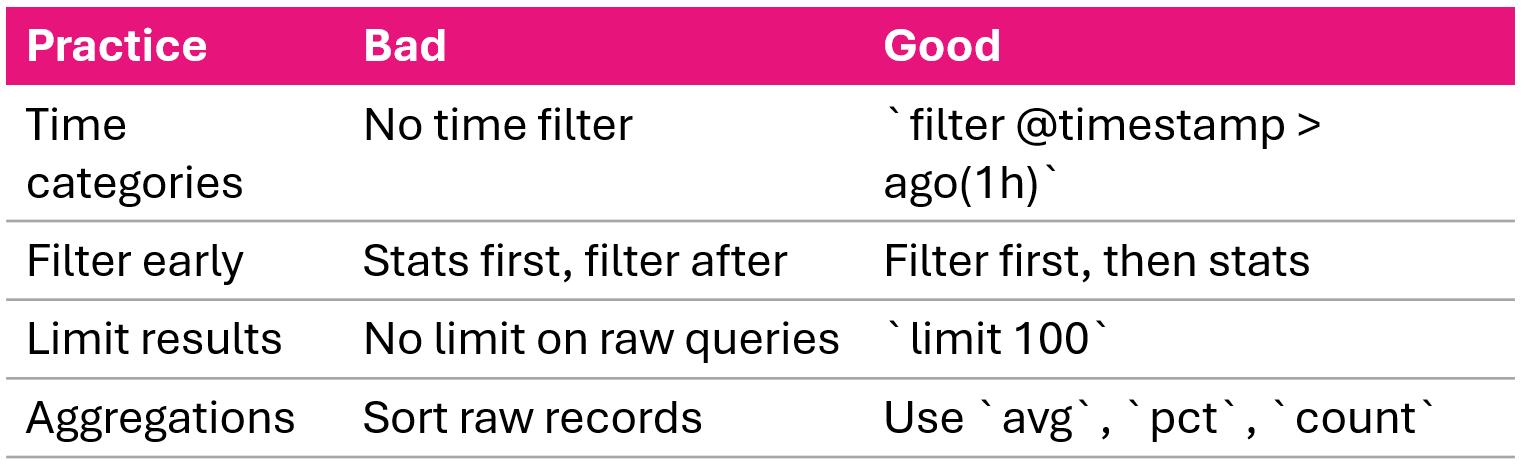
Rilevamento anomalie e correlazione
Rilevamento di anomalie statistiche
- Calcola baseline: media e dev. std su 7 giorni
- Confronta il periodo attuale con la baseline
- Segnala valori > 2 deviazioni standard come anomali
Correlazione del tasso di errore
fields @timestamp, level
| stats count() as total_requests,
        sum(case(level = "ERROR", 1, 0)) as errors
        by bin(5m)
| fields error_rate = (errors / total_requests) * 100
Riepilogo
- CloudWatch Logs Insights: servizio di query interattivo, senza infrastruttura
- Tre linguaggi di query: Logs Insights QL, OpenSearch PPL, OpenSearch SQL
- Sei scenari di troubleshooting: picchi di errori, endpoint lenti, auth fallite, timeout DB, memory leak, tracciamento richieste
- Tecniche avanzate:
parseper testo non strutturato,bin()per serie temporali,pct()per percentili - Correlazione e anomalie: analisi del tasso di errore, confronto con baseline statistica
- Dall'indagine all'automazione: metric filters e allarmi chiudono il cerchio
Esercitiamoci!
Monitoraggio e risoluzione dei problemi su AWS

