Analiza logów
Monitoring and Troubleshooting AWS

John Q. Martin
Principal Consultant
Struktura zapytania Logs Insights
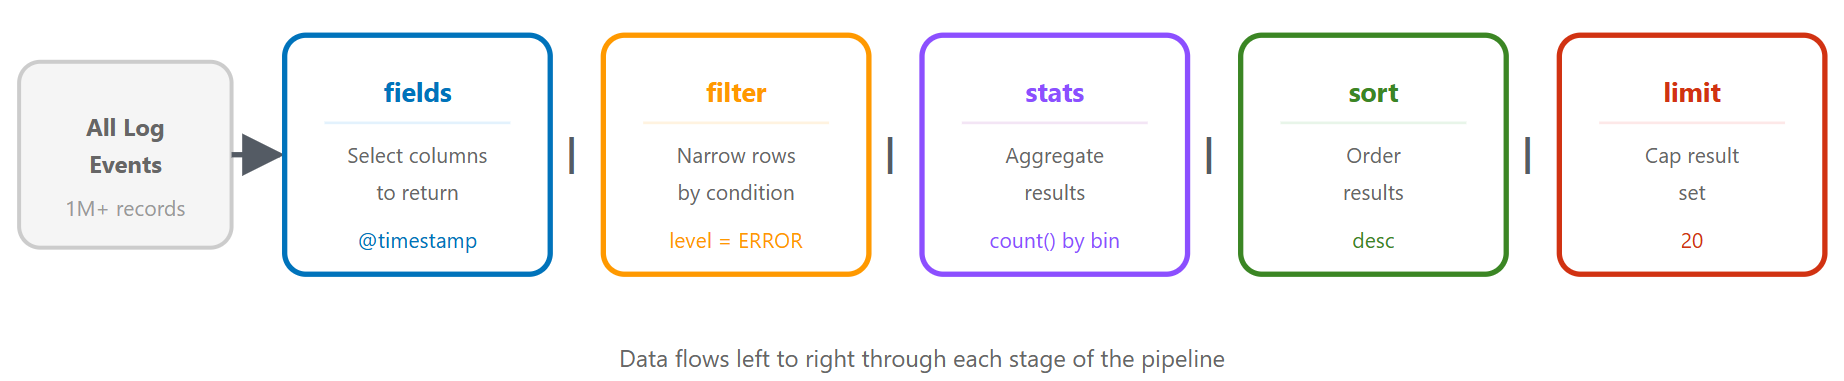
Języki zapytań: to samo zapytanie na trzy sposoby
CloudWatch Logs Insights QL
fields @timestamp, @message, level
| filter level = "ERROR"
| filter @timestamp > ago(1h)
| sort @timestamp desc
| limit 20
OpenSearch PPL
source = `/aws/lambda/my-function`
| where level = 'ERROR' and @timestamp > ago(1h)
| fields @timestamp, @message, level
| sort - @timestamp
| head 20
Języki zapytań: OpenSearch SQL
OpenSearch SQL
SELECT `@timestamp`, `@message`, level
FROM `/aws/lambda/my-function`
WHERE level = 'ERROR'
  AND `@timestamp` > ago(1h)
ORDER BY `@timestamp` DESC
LIMIT 20
- Standardowa składnia SELECT / FROM / WHERE
- Obsługuje JOINy między grupami logów
- Wybierz język, który pasuje twojemu zespołowi
Scenariusz 1: wykrywanie skoków błędów
fields @timestamp, @message, level
| filter level = "ERROR"
| stats count() as error_count by bin(5m)
| sort @timestamp desc
Rozszerzone: grupowanie według typu błędu
fields @timestamp, error_type, error_message
| filter level = "ERROR"
| stats count() as count by error_type, bin(5m)
| sort count desc
Scenariusz 2: wolne punkty końcowe API
fields @timestamp, endpoint, response_time, status_code
| filter response_time > 1000
| stats avg(response_time) as avg_time,
        max(response_time) as max_time,
        count() as slow_requests
        by endpoint
| sort avg_time desc
Drążenie danych
fields @timestamp, endpoint, response_time, user_id, request_id
| filter endpoint = "/api/users" and response_time > 1000
| sort response_time desc
| limit 20
Scenariusz 3: nieudane uwierzytelnianie
fields @timestamp, user_id, ip_address, action
| filter action = "login_failed"
| stats count() as failed_attempts by user_id, ip_address
| sort failed_attempts desc
| limit 50
Analiza czasowa
fields @timestamp, user_id, ip_address
| filter action = "login_failed"
| stats count() as attempts by ip_address, bin(1h)
| filter attempts > 10
| sort attempts desc
Scenariusze 4 i 5: przekroczenia limitu czasu i wycieki pamięci
Przekroczenia limitu czasu bazy danych
fields @timestamp, @message
| filter @message like /database/ and @message like /timeout|error|failed/
| parse @message "timeout after * seconds" as timeout_duration
| stats count() as timeout_count,
        avg(timeout_duration) as avg_timeout
        by bin(5m)
Wykrywanie wycieków pamięci
fields @timestamp, memory_used_mb, heap_size_mb
| stats avg(memory_used_mb) as avg_memory,
        max(memory_used_mb) as max_memory
        by bin(1h)
| sort @timestamp asc
Scenariusz 6: śledzenie żądań
fields @timestamp, @message, request_id, service, action
| filter request_id = "abc123def456"
| sort @timestamp asc
Śledzenie w wielu usługach
fields @timestamp, service, action, duration_ms, status
| filter request_id = "abc123def456"
| sort @timestamp asc
| display @timestamp, service, action, duration_ms, status
Techniki zaawansowane: parse i wyrażenia regularne
Parsowanie nieustrukturyzowanych logów
fields @timestamp, @message
| parse @message "[*] User * failed to access resource * from IP *"
    as level, user, resource, ip
Parsowanie wyrażeniami regularnymi
| parse @message /Request completed in (?<duration>\d+)ms with status (?<status>\d+)/
Techniki zaawansowane: pola obliczane
fields @timestamp, requests, errors
| fields error_rate = (errors / requests) * 100

fields @timestamp, status_code
| fields status_category =
    case(status_code < 300, "success",
         status_code < 500, "client_error",
         status_code >= 500, "server_error")
| stats count() as request_count by status_category
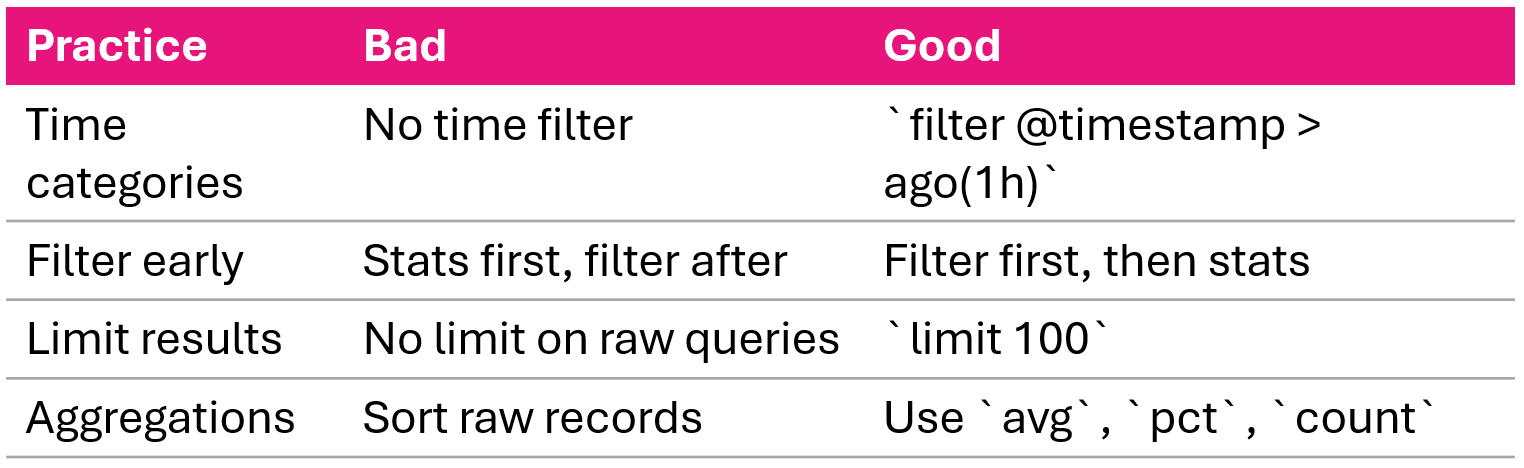
Optymalizacja zapytań
Wykrywanie anomalii i korelacja
Statystyczne wykrywanie anomalii
- Wyznacz punkt odniesienia: średnia i odchylenie standardowe z 7 dni
- Porównaj bieżący okres z punktem odniesienia
- Oznacz wartości > 2 odchyleń standardowych jako anomalie
Korelacja współczynnika błędów
fields @timestamp, level
| stats count() as total_requests,
        sum(case(level = "ERROR", 1, 0)) as errors
        by bin(5m)
| fields error_rate = (errors / total_requests) * 100
Podsumowanie
- CloudWatch Logs Insights: interaktywna usługa zapytań bez potrzeby zarządzania infrastrukturą
- Trzy języki zapytań: Logs Insights QL, OpenSearch PPL, OpenSearch SQL
- Sześć scenariuszy diagnostycznych: skoki błędów, wolne punkty końcowe, nieudane uwierzytelnianie, przekroczenia limitu czasu bazy danych, wycieki pamięci, śledzenie żądań
- Techniki zaawansowane:
parsedla tekstu nieustrukturyzowanego,bin()dla szeregów czasowych,pct()dla percentyli - Korelacja i wykrywanie anomalii: analiza współczynnika błędów, porównanie ze statystycznym punktem odniesienia
- Od analizy do automatyzacji: filtry metryk i alarmy zamykają pętlę
Czas na praktykę!
Monitoring and Troubleshooting AWS

