로그 인사이트와 분석
AWS 모니터링 및 문제 해결

John Q. Martin
Principal Consultant
Logs Insights 쿼리 구조
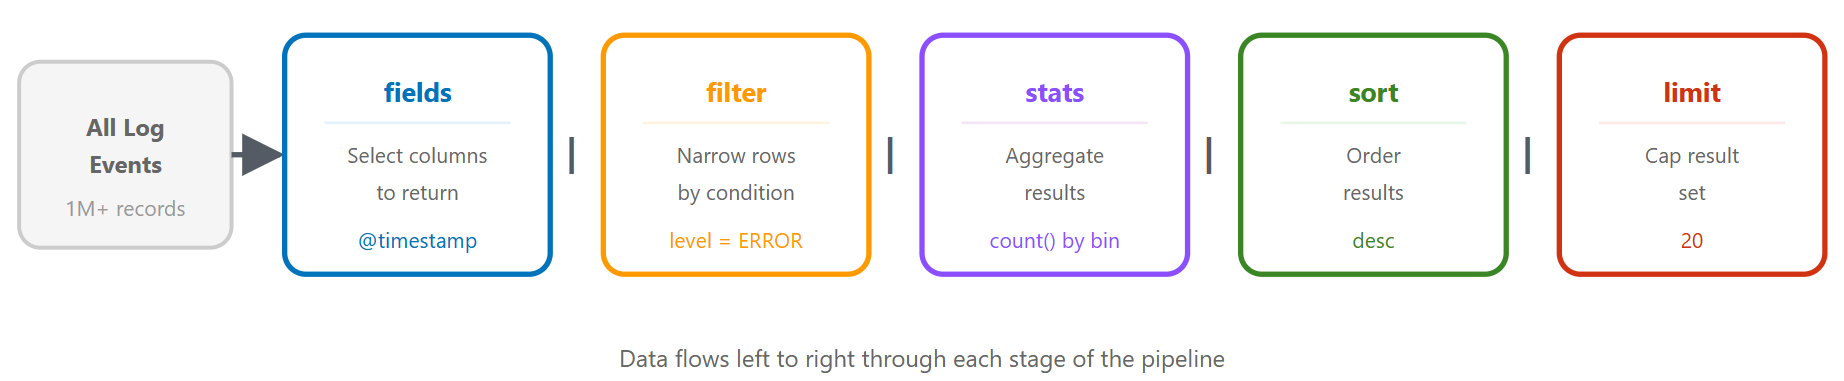
쿼리 언어: 같은 쿼리, 세 가지 방식
CloudWatch Logs Insights QL
fields @timestamp, @message, level
| filter level = "ERROR"
| filter @timestamp > ago(1h)
| sort @timestamp desc
| limit 20
OpenSearch PPL
source = `/aws/lambda/my-function`
| where level = 'ERROR' and @timestamp > ago(1h)
| fields @timestamp, @message, level
| sort - @timestamp
| head 20
쿼리 언어: OpenSearch SQL
OpenSearch SQL
SELECT `@timestamp`, `@message`, level
FROM `/aws/lambda/my-function`
WHERE level = 'ERROR'
  AND `@timestamp` > ago(1h)
ORDER BY `@timestamp` DESC
LIMIT 20
- 표준 SELECT / FROM / WHERE 구문
- 로그 그룹 간 JOIN 추가 가능
- 팀에 맞는 방식을 선택하세요
시나리오 1: 오류 급증 찾기
fields @timestamp, @message, level
| filter level = "ERROR"
| stats count() as error_count by bin(5m)
| sort @timestamp desc
개선: 오류 유형별 그룹화
fields @timestamp, error_type, error_message
| filter level = "ERROR"
| stats count() as count by error_type, bin(5m)
| sort count desc
시나리오 2: 느린 API 엔드포인트
fields @timestamp, endpoint, response_time, status_code
| filter response_time > 1000
| stats avg(response_time) as avg_time,
        max(response_time) as max_time,
        count() as slow_requests
        by endpoint
| sort avg_time desc
세부 분석
fields @timestamp, endpoint, response_time, user_id, request_id
| filter endpoint = "/api/users" and response_time > 1000
| sort response_time desc
| limit 20
시나리오 3: 인증 실패
fields @timestamp, user_id, ip_address, action
| filter action = "login_failed"
| stats count() as failed_attempts by user_id, ip_address
| sort failed_attempts desc
| limit 50
시간대별 분석
fields @timestamp, user_id, ip_address
| filter action = "login_failed"
| stats count() as attempts by ip_address, bin(1h)
| filter attempts > 10
| sort attempts desc
시나리오 4 & 5: 데이터베이스 타임아웃과 메모리 누수
데이터베이스 타임아웃
fields @timestamp, @message
| filter @message like /database/ and @message like /timeout|error|failed/
| parse @message "timeout after * seconds" as timeout_duration
| stats count() as timeout_count,
        avg(timeout_duration) as avg_timeout
        by bin(5m)
메모리 누수 탐지
fields @timestamp, memory_used_mb, heap_size_mb
| stats avg(memory_used_mb) as avg_memory,
        max(memory_used_mb) as max_memory
        by bin(1h)
| sort @timestamp asc
시나리오 6: 요청 추적
fields @timestamp, @message, request_id, service, action
| filter request_id = "abc123def456"
| sort @timestamp asc
다중 서비스 추적
fields @timestamp, service, action, duration_ms, status
| filter request_id = "abc123def456"
| sort @timestamp asc
| display @timestamp, service, action, duration_ms, status
고급 기법: parse, 정규식
비정형 로그 파싱
fields @timestamp, @message
| parse @message "[*] User * failed to access resource * from IP *"
    as level, user, resource, ip
정규식 파싱
| parse @message /Request completed in (?<duration>\d+)ms with status (?<status>\d+)/
고급 기법: 계산된 필드
fields @timestamp, requests, errors
| fields error_rate = (errors / requests) * 100

fields @timestamp, status_code
| fields status_category =
    case(status_code < 300, "success",
         status_code < 500, "client_error",
         status_code >= 500, "server_error")
| stats count() as request_count by status_category
쿼리 최적화
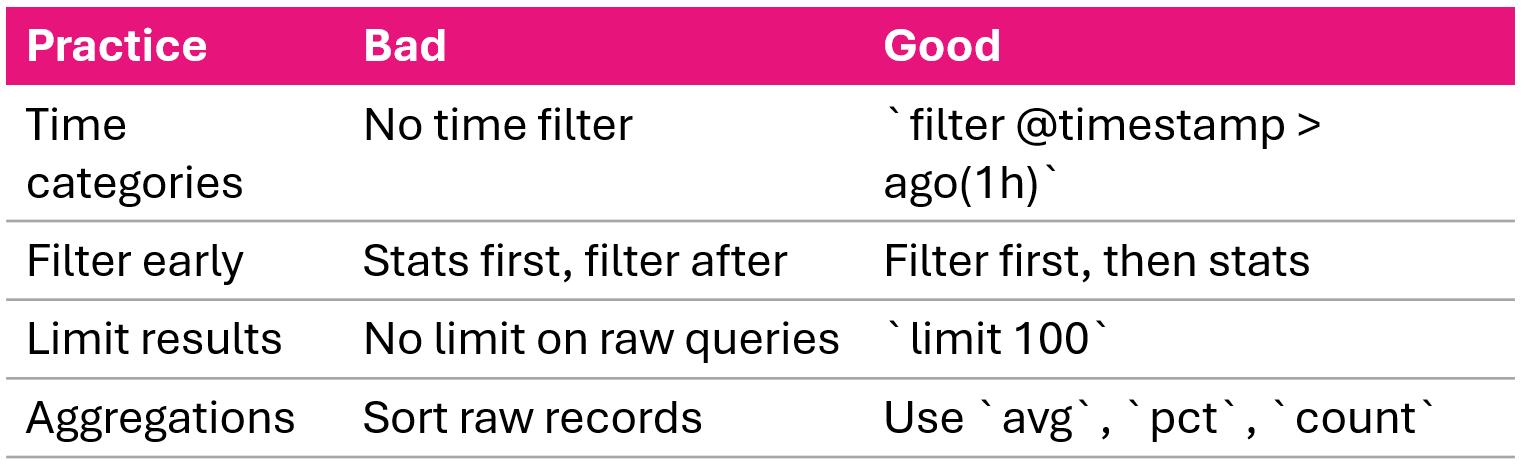
이상 탐지와 상관관계 분석
통계적 이상 탐지
- 기준선 계산: 7일간 평균과 표준편차
- 현재 기간을 기준선과 비교
- 표준편차 2 이상인 값을 이상치로 표시
오류율 상관관계
fields @timestamp, level
| stats count() as total_requests,
        sum(case(level = "ERROR", 1, 0)) as errors
        by bin(5m)
| fields error_rate = (errors / total_requests) * 100
요약
- CloudWatch Logs Insights: 인프라 없이 사용하는 대화형 쿼리 서비스
- 세 가지 쿼리 언어: Logs Insights QL, OpenSearch PPL, OpenSearch SQL
- 여섯 가지 문제 해결 시나리오: 오류 급증, 느린 엔드포인트, 인증 실패, DB 타임아웃, 메모리 누수, 요청 추적
- 고급 기법: 비정형 텍스트용
parse, 시계열용bin(), 백분위수용pct() - 상관관계와 이상 탐지: 오류율 분석, 통계적 기준선 비교
- 조사에서 자동화로: 메트릭 필터와 알람으로 마무리
연습해 봅시다!
AWS 모니터링 및 문제 해결

