AWS 모니터링 및 문제 해결
John Q. Martin
Principal Consultant
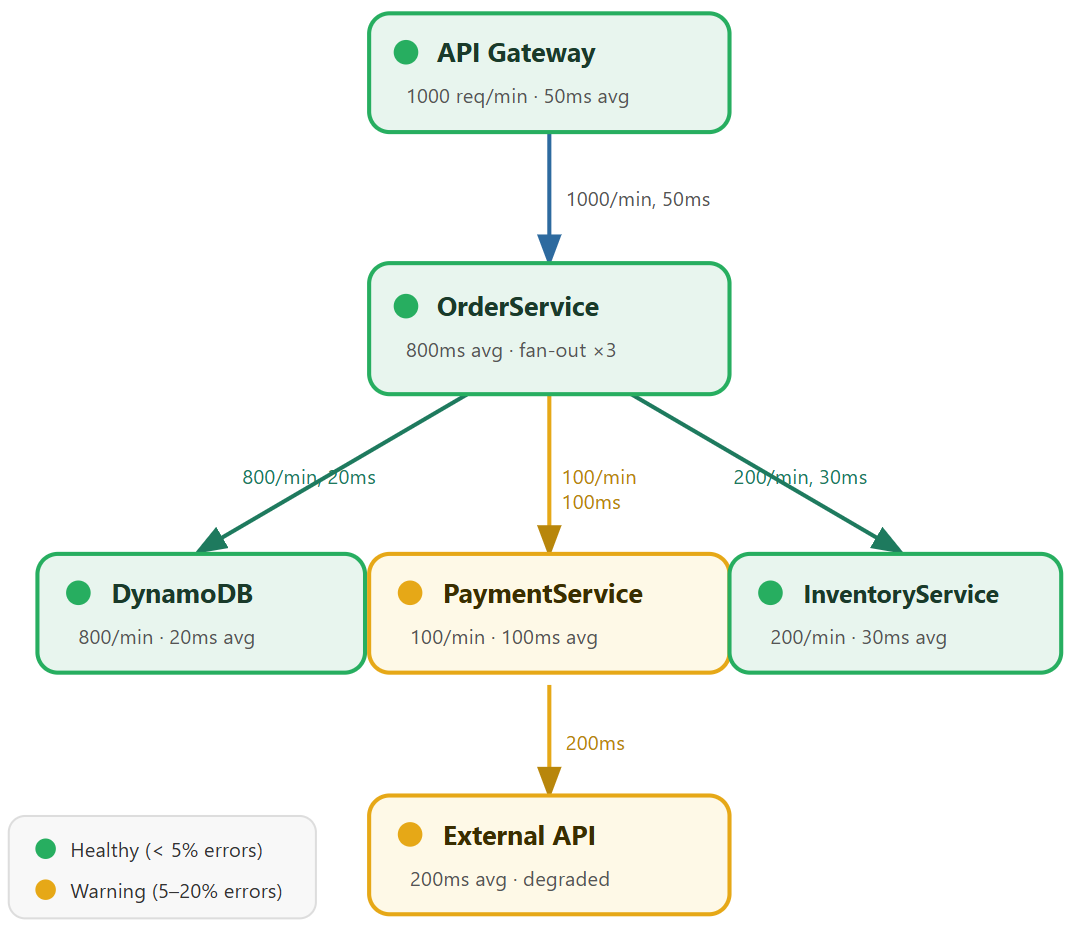
트레이스 데이터로 자동 생성: 별도 설정 불필요

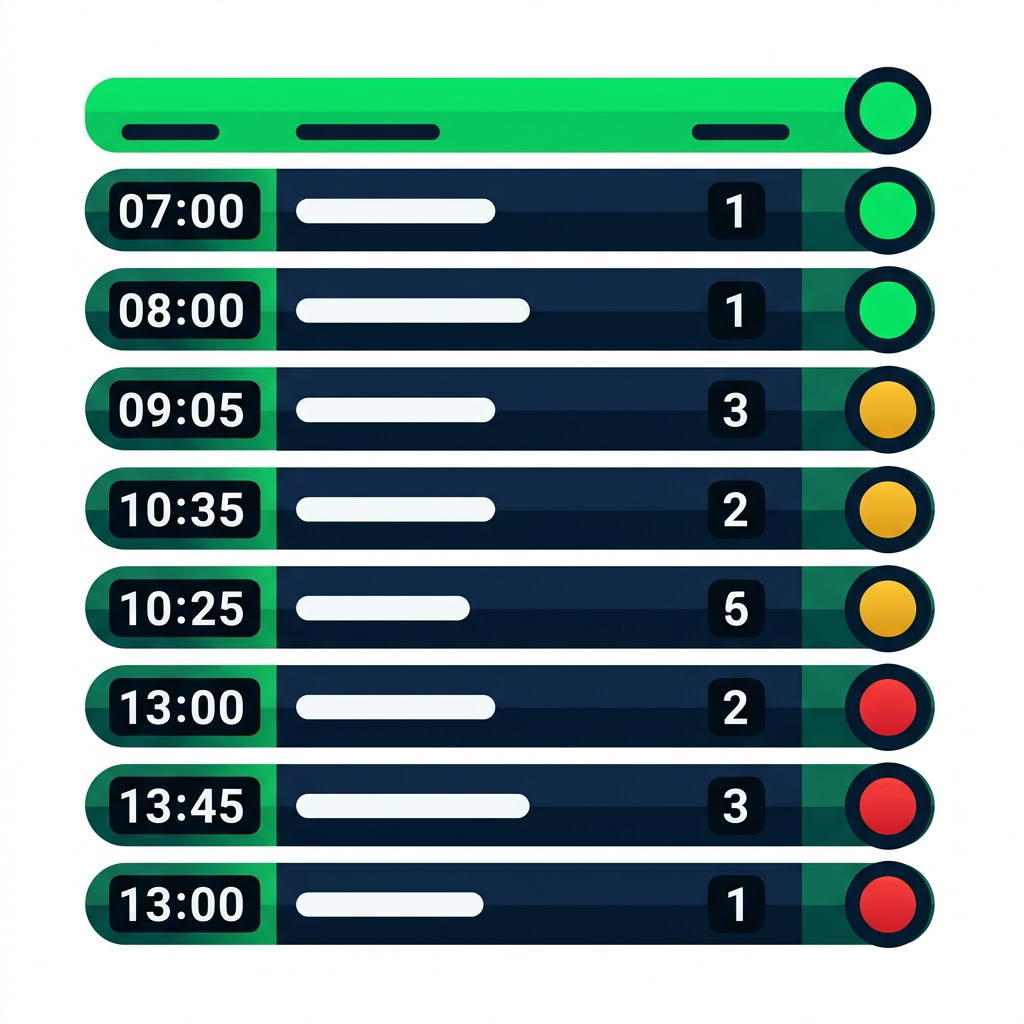
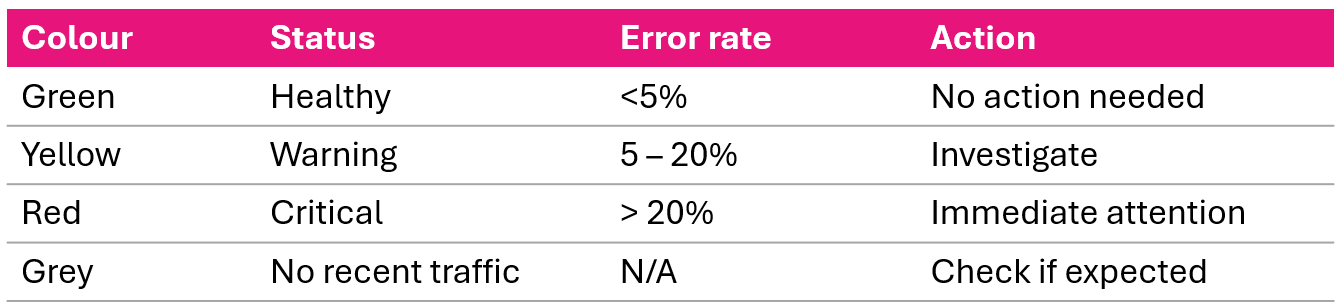
한눈에 보기: 초록색 = 정시 · 주황색 = 지연 · 빨간색 = 중단

서비스 맵을 열면 초록색이 아닌 부분부터 확인하세요.
노드를 클릭하면 응답 시간 분포, HTTP 상태 분석, 오류 유형을 확인할 수 있습니다.

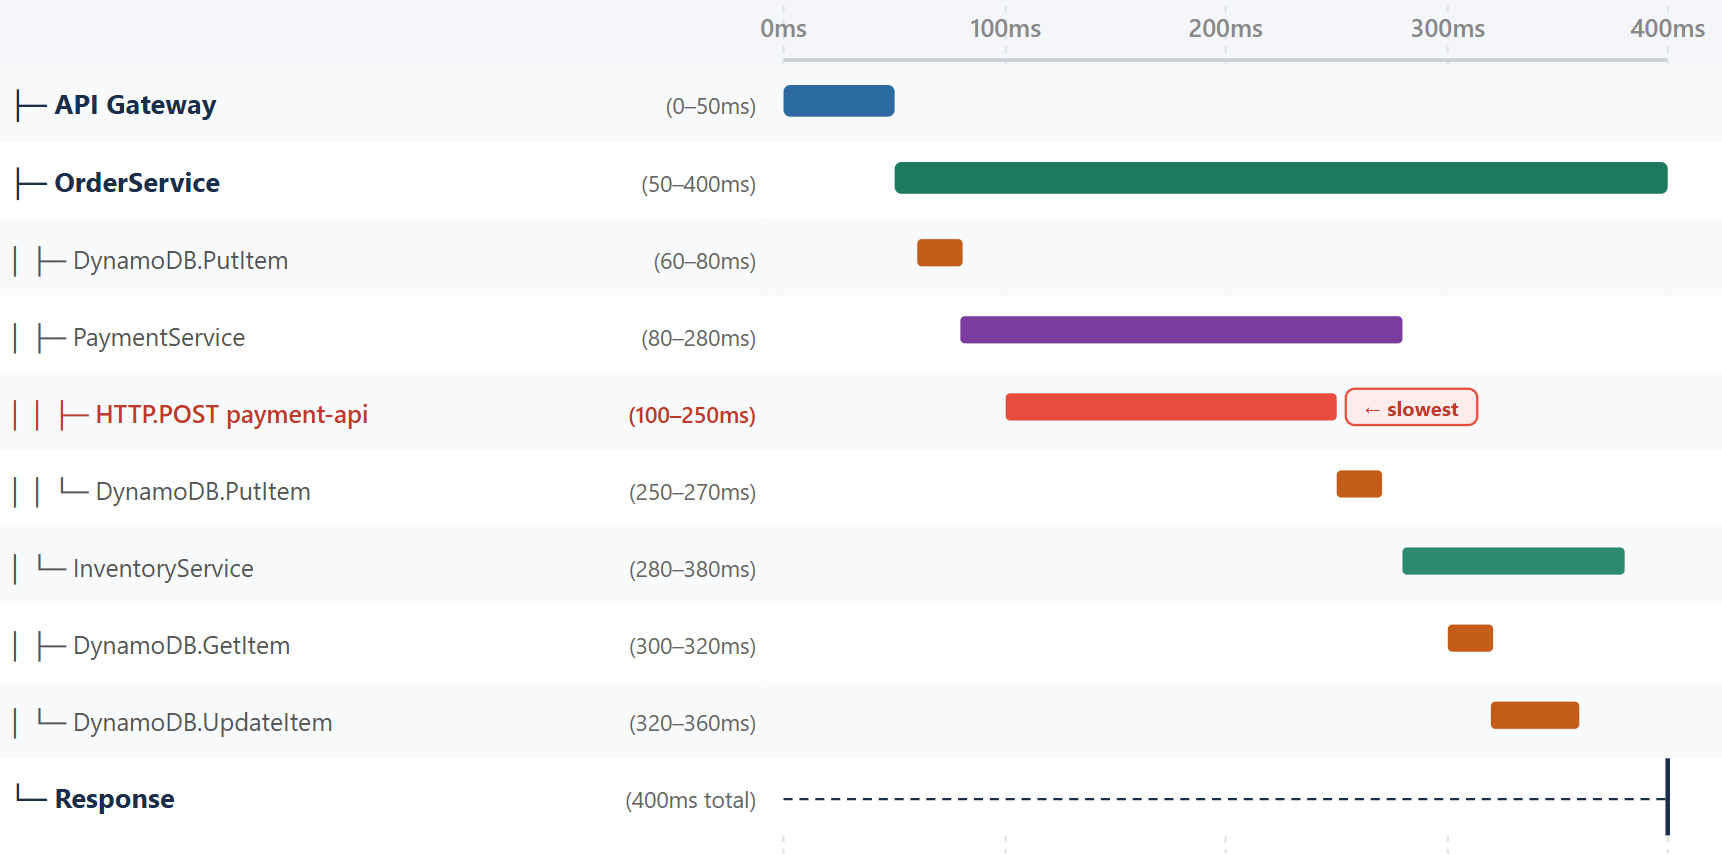
API Gateway (50ms)
-> OrderService (50ms)
-> PaymentService (100ms)
-> External API (200ms)
Total: 400ms
External API = 전체 지연 시간의 50%
대안 경로와 비교:
OrderService -> DynamoDB
Total: 120ms (fast)


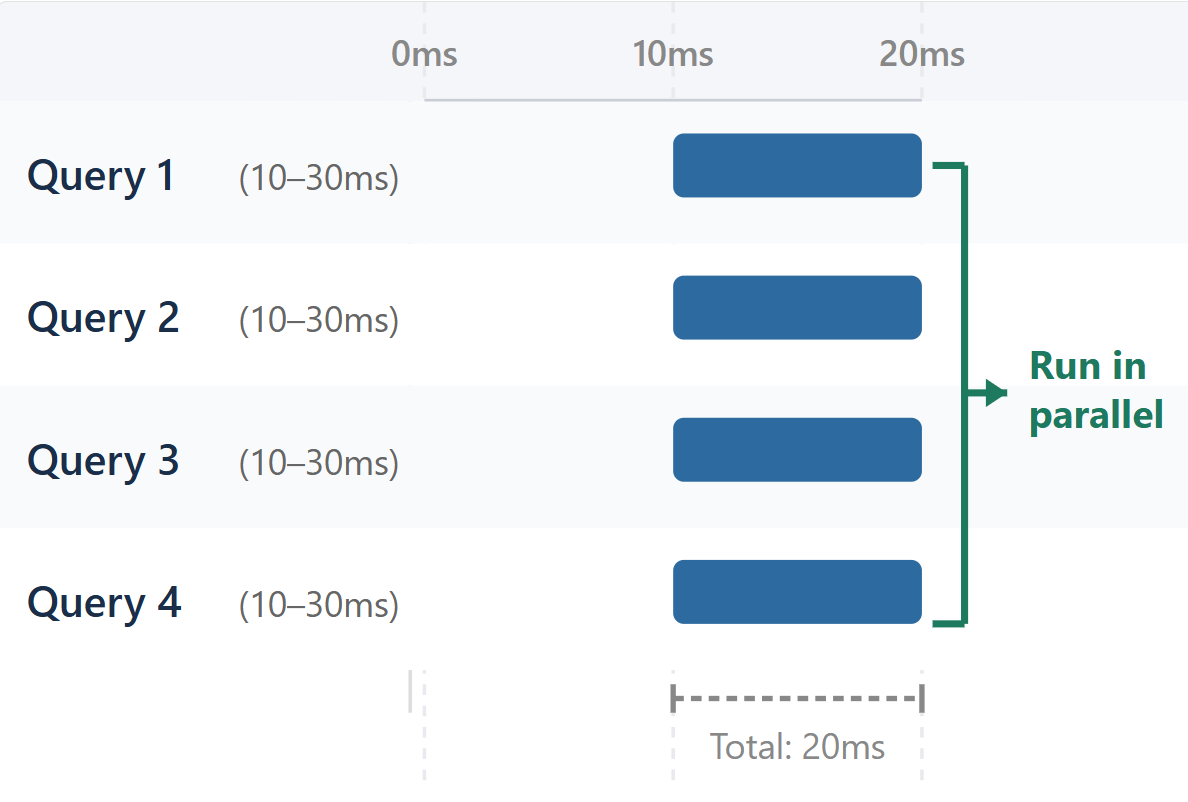
Query 1 (10-30ms)
-> Query 2 (30-50ms)
-> Query 3 (50-70ms)
-> Query 4 (70-90ms)

Get user list (10-20ms)
Get user 1 details (20-30ms)
Get user 2 details (30-40ms)
... ×100 sequential queries
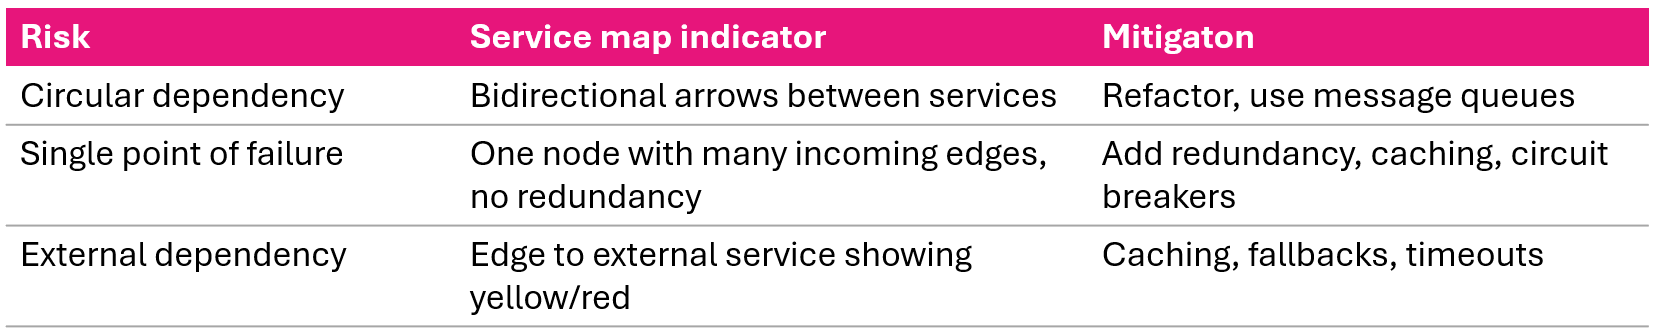
해결책: 쿼리 일괄 처리, 즉시 로딩(eager loading)
해결책: 요청 일괄 처리, 메시지 큐, 캐싱

해결책: 프로비저닝된 동시성, 초기화 최적화
Service A [Error]
-> Service B [Timeout 5s]
-> Service C [Timeout 5s]
-> Database [Timeout 5s]
트레이스 계층 전체에 동일한 타임아웃 블록이 쌓여서 나타남
해결책: 타임아웃, 서킷 브레이커, 폴백

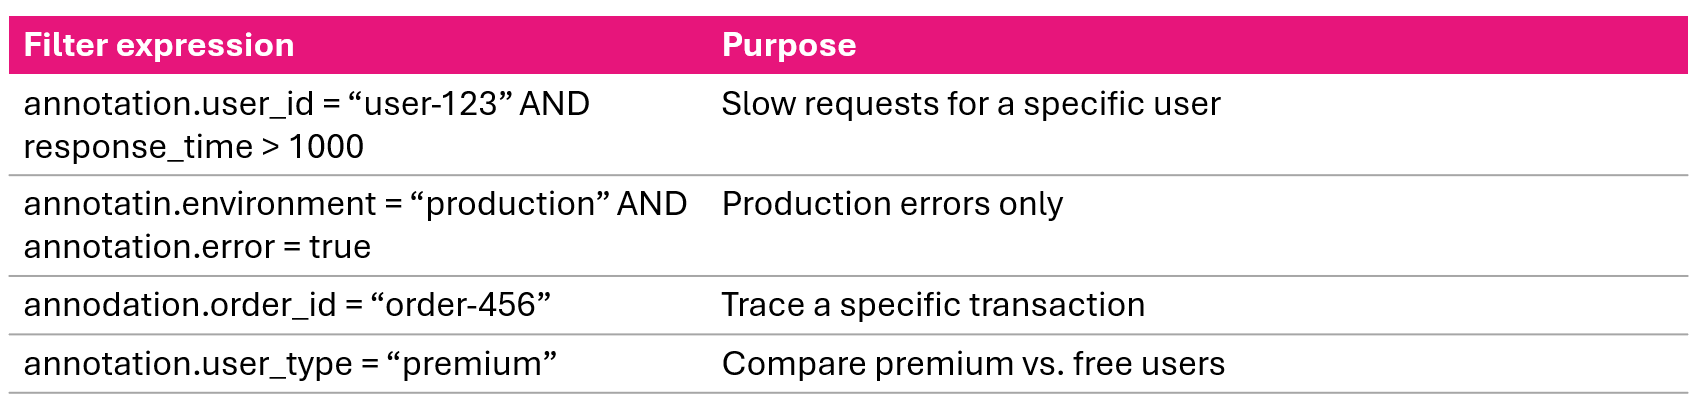
그룹 비교:
response_time > 1000ms, 지속 시간순 정렬
# High latency alarm
aws cloudwatch put-metric-alarm \
--alarm-name HighLatency \
--metric-name ResponseTime \
--namespace AWS/XRay \
--statistic Average \
--period 300 \
--threshold 1000 \
--comparison-operator GreaterThanThreshold
# High error count alarm
aws cloudwatch put-metric-alarm \
--alarm-name HighErrorCount \
--metric-name ErrorCount \
--namespace AWS/XRay \
--statistic Sum \
--period 300 \
--threshold 50 \
--comparison-operator GreaterThanThreshold
AWS 모니터링 및 문제 해결