लॉग इनसाइट्स और विश्लेषण
Monitoring और Troubleshooting AWS

John Q. Martin
Principal Consultant
Logs Insights क्वेरी संरचना
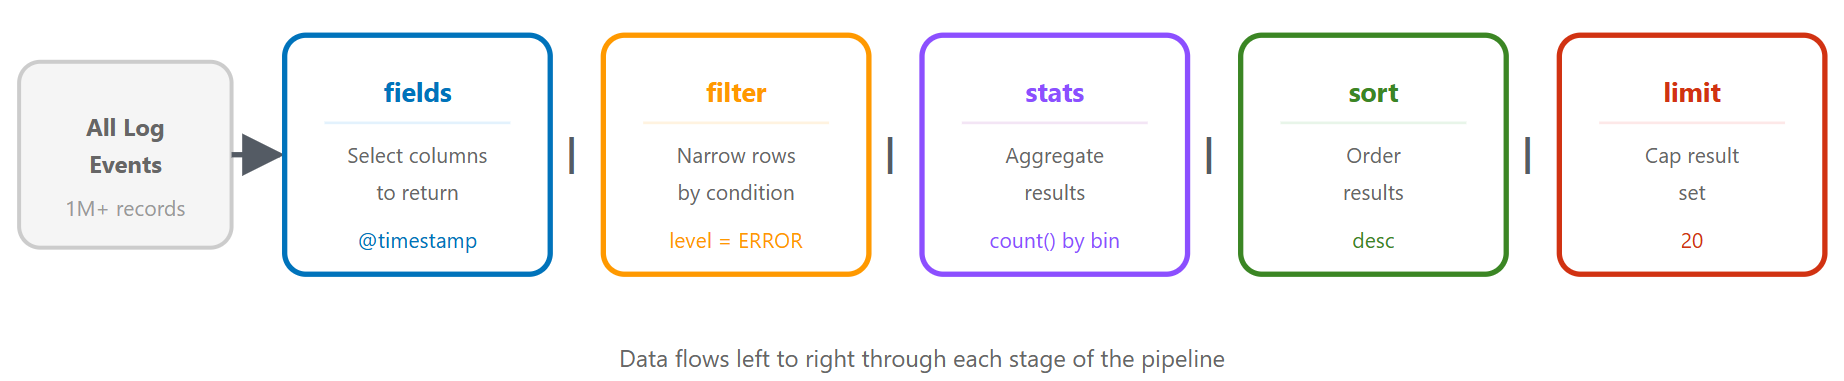
क्वेरी भाषाएँ: एक ही क्वेरी, तीन तरीके
CloudWatch Logs Insights QL
fields @timestamp, @message, level
| filter level = "ERROR"
| filter @timestamp > ago(1h)
| sort @timestamp desc
| limit 20
OpenSearch PPL
source = `/aws/lambda/my-function`
| where level = 'ERROR' and @timestamp > ago(1h)
| fields @timestamp, @message, level
| sort - @timestamp
| head 20
क्वेरी भाषाएँ: OpenSearch SQL
OpenSearch SQL
SELECT `@timestamp`, `@message`, level
FROM `/aws/lambda/my-function`
WHERE level = 'ERROR'
  AND `@timestamp` > ago(1h)
ORDER BY `@timestamp` DESC
LIMIT 20
- मानक SELECT / FROM / WHERE सिंटैक्स
- लॉग ग्रुप्स के बीच JOINs जोड़ता है
- अपनी टीम के मुताबिक जो सूट करे, उसे चुनें
परिदृश्य 1: त्रुटि स्पाइक्स ढूँढना
fields @timestamp, @message, level
| filter level = "ERROR"
| stats count() as error_count by bin(5m)
| sort @timestamp desc
उन्नत: त्रुटि प्रकार के अनुसार समूहित करें
fields @timestamp, error_type, error_message
| filter level = "ERROR"
| stats count() as count by error_type, bin(5m)
| sort count desc
परिदृश्य 2: धीमे API एंडपॉइंट्स
fields @timestamp, endpoint, response_time, status_code
| filter response_time > 1000
| stats avg(response_time) as avg_time,
        max(response_time) as max_time,
        count() as slow_requests
        by endpoint
| sort avg_time desc
ड्रिल-डाउन
fields @timestamp, endpoint, response_time, user_id, request_id
| filter endpoint = "/api/users" and response_time > 1000
| sort response_time desc
| limit 20
परिदृश्य 3: असफल प्रमाणीकरण
fields @timestamp, user_id, ip_address, action
| filter action = "login_failed"
| stats count() as failed_attempts by user_id, ip_address
| sort failed_attempts desc
| limit 50
समय-आधारित विश्लेषण
fields @timestamp, user_id, ip_address
| filter action = "login_failed"
| stats count() as attempts by ip_address, bin(1h)
| filter attempts > 10
| sort attempts desc
परिदृश्य 4 और 5: डेटाबेस टाइमआउट्स और मेमोरी लीक्स
डेटाबेस टाइमआउट्स
fields @timestamp, @message
| filter @message like /database/ and @message like /timeout|error|failed/
| parse @message "timeout after * seconds" as timeout_duration
| stats count() as timeout_count,
        avg(timeout_duration) as avg_timeout
        by bin(5m)
मेमोरी लीक डिटेक्शन
fields @timestamp, memory_used_mb, heap_size_mb
| stats avg(memory_used_mb) as avg_memory,
        max(memory_used_mb) as max_memory
        by bin(1h)
| sort @timestamp asc
परिदृश्य 6: रिक्वेस्ट ट्रेसिंग
fields @timestamp, @message, request_id, service, action
| filter request_id = "abc123def456"
| sort @timestamp asc
मल्टी-सर्विस ट्रेस
fields @timestamp, service, action, duration_ms, status
| filter request_id = "abc123def456"
| sort @timestamp asc
| display @timestamp, service, action, duration_ms, status
एडवांस्ड तकनीक: parse, Regex
असंरचित लॉग्स को पार्स करना
fields @timestamp, @message
| parse @message "[*] User * failed to access resource * from IP *"
    as level, user, resource, ip
Regex पार्सिंग
| parse @message /Request completed in (?<duration>\d+)ms with status (?<status>\d+)/
एडवांस्ड तकनीक: Calculated Fields
fields @timestamp, requests, errors
| fields error_rate = (errors / requests) * 100

fields @timestamp, status_code
| fields status_category =
    case(status_code < 300, "success",
         status_code < 500, "client_error",
         status_code >= 500, "server_error")
| stats count() as request_count by status_category
क्वेरी ऑप्टिमाइज़ेशन
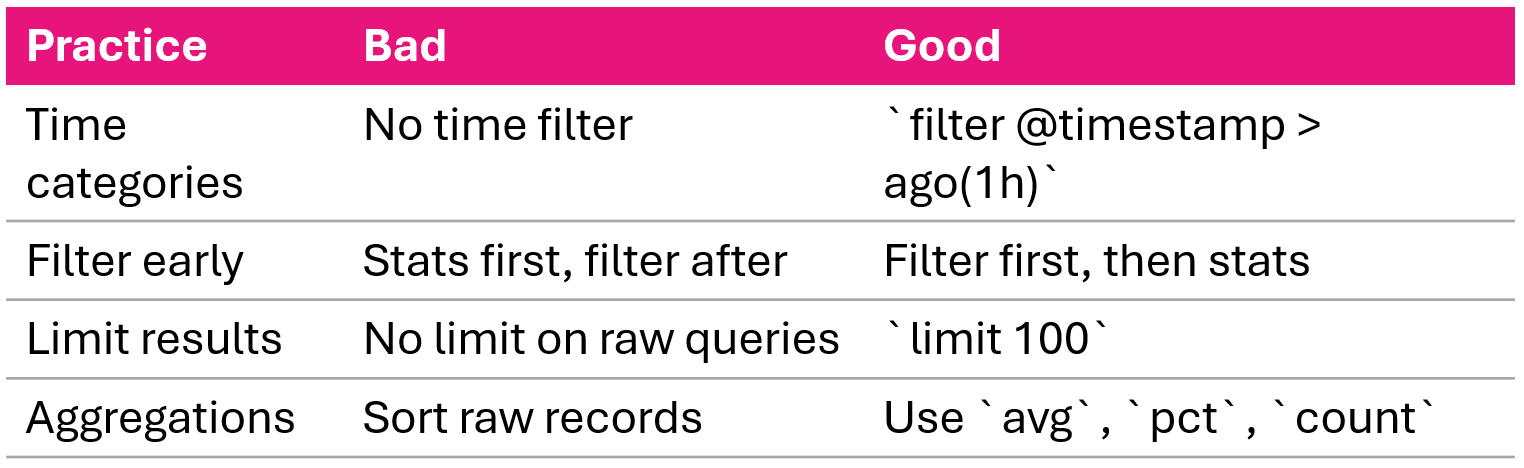
अनॉमली डिटेक्शन और कोरिलेशन
सांख्यिकीय एनॉमली डिटेक्शन
- बेसलाइन निकालें: 7 दिनों का avg और stddev
- मौजूदा अवधि को बेसलाइन से तुलना करें
- 2 standard deviations से अधिक मानों को अनोमलस के रूप में फ़्लैग करें
एरर रेट कोरिलेशन
fields @timestamp, level
| stats count() as total_requests,
        sum(case(level = "ERROR", 1, 0)) as errors
        by bin(5m)
| fields error_rate = (errors / total_requests) * 100
सारांश
- CloudWatch Logs Insights: इंटरैक्टिव क्वेरी सर्विस, इन्फ्रास्ट्रक्चर की जरूरत नहीं
- तीन क्वेरी भाषाएँ: Logs Insights QL, OpenSearch PPL, OpenSearch SQL
- छह ट्रबलशूटिंग परिदृश्य: एरर स्पाइक्स, स्लो एंडपॉइंट्स, फेल्ड ऑथ, DB टाइमआउट्स, मेमोरी लीक्स, रिक्वेस्ट ट्रेसिंग
- एडवांस्ड तकनीक: असंरचित टेक्स्ट के लिए
parse, टाइम-सीरीज़ के लिएbin(), परसेंटाइल्स के लिएpct() - कोरिलेशन और अनॉमली डिटेक्शन: एरर रेट विश्लेषण, सांख्यिकीय बेसलाइन तुलना
- इन्वेस्टिगेशन से ऑटोमेशन तक: मेट्रिक फ़िल्टर्स और अलार्म्स से लूप पूरा करें
अभ्यास करते हैं!
Monitoring और Troubleshooting AWS

