視覺化的力量

傳達資料洞見

Joe Franklin

Senior Curriculum Manager, DataCamp

來玩個遊戲
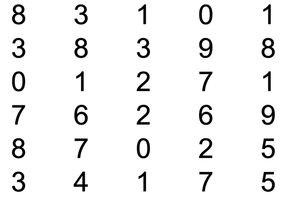
     

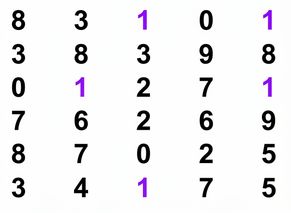
Screen Shot 2022-09-06 at 6.27.28 PM.png

有多少個 0?

傳達資料洞見

換個規則


Screen Shot 2022-09-06 at 6.34.08 PM.png

有多少個 1?

傳達資料洞見

通往理解的入口


圖片與圖像是理解的入口。


視覺化把資訊轉成更易讀的形式,幫助發現洞見。

Person placing chart on displayboard

傳達資料洞見

看得更清楚

Lines converging to form one solid line

視覺化是傳達資料洞見的第一線工具。


圖表能簡化每日產生的大量資訊。


視覺化提供資料的彙整視角,凸顯趨勢與模式。

傳達資料洞見

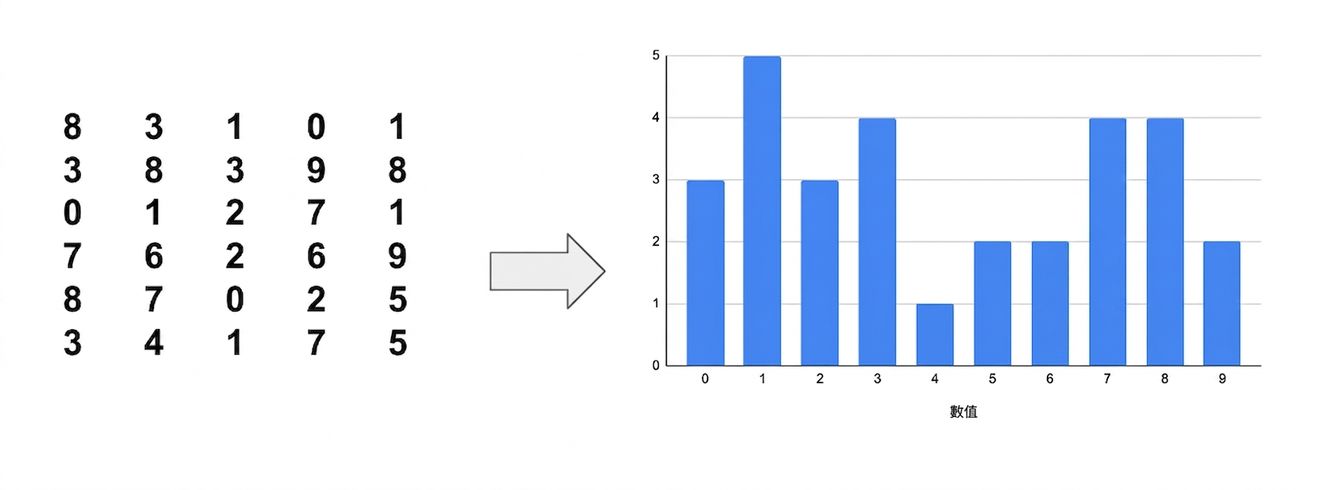
視覺化摘要

Raw numbers summarized into barchart

傳達資料洞見

正向影響

視覺化的正面效益

  • 決策更快
  • 決策更佳
  • 更能吸引決策者
  • 比單純彙總更完整的全貌

Man on rocket leading crowd of followers

傳達資料洞見

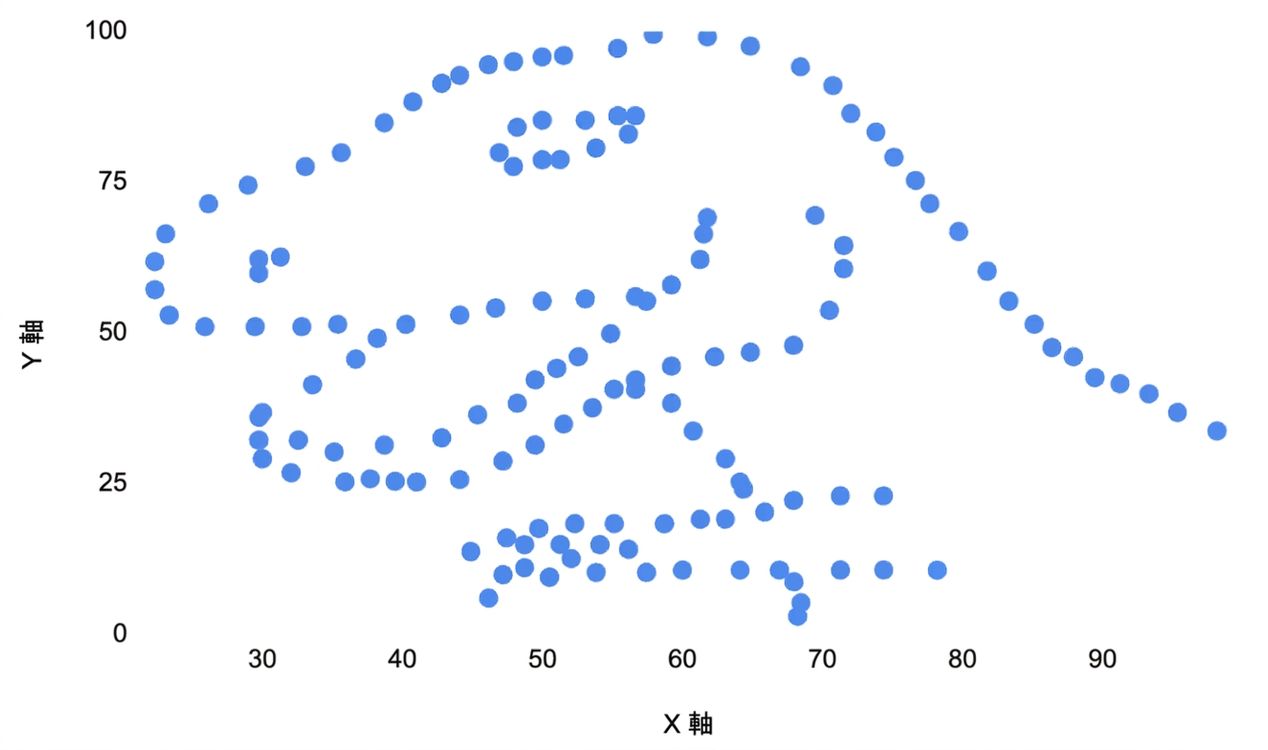
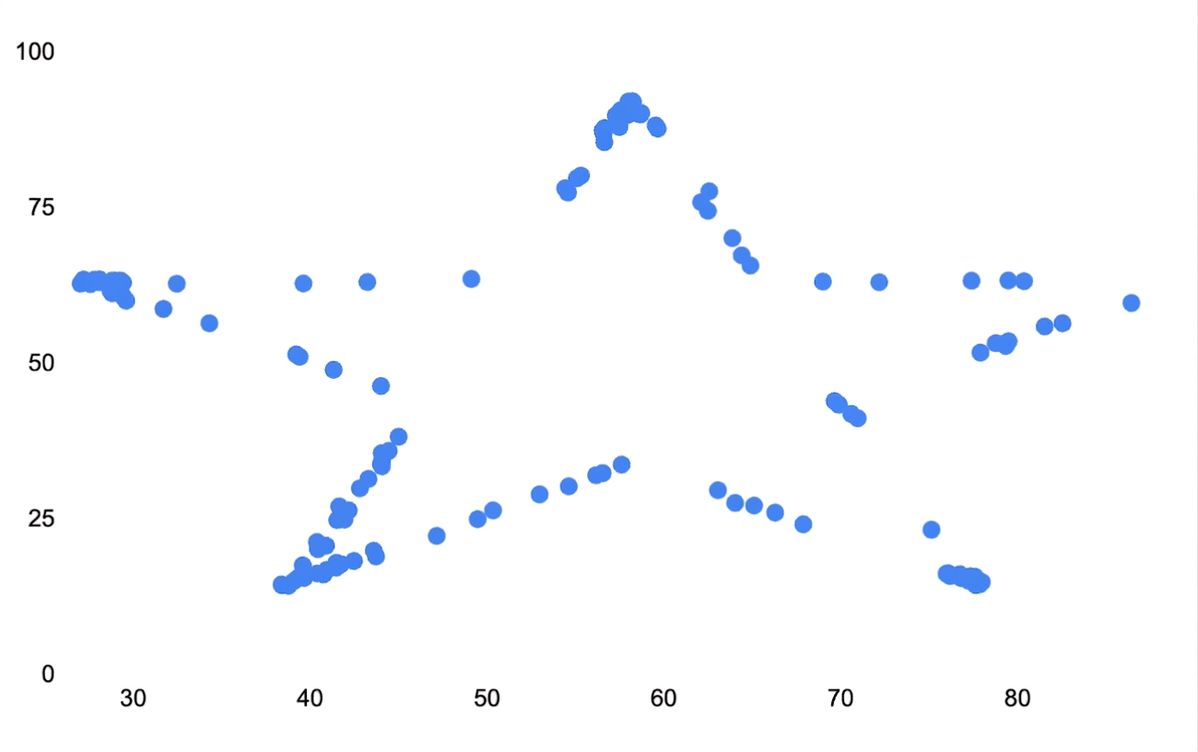
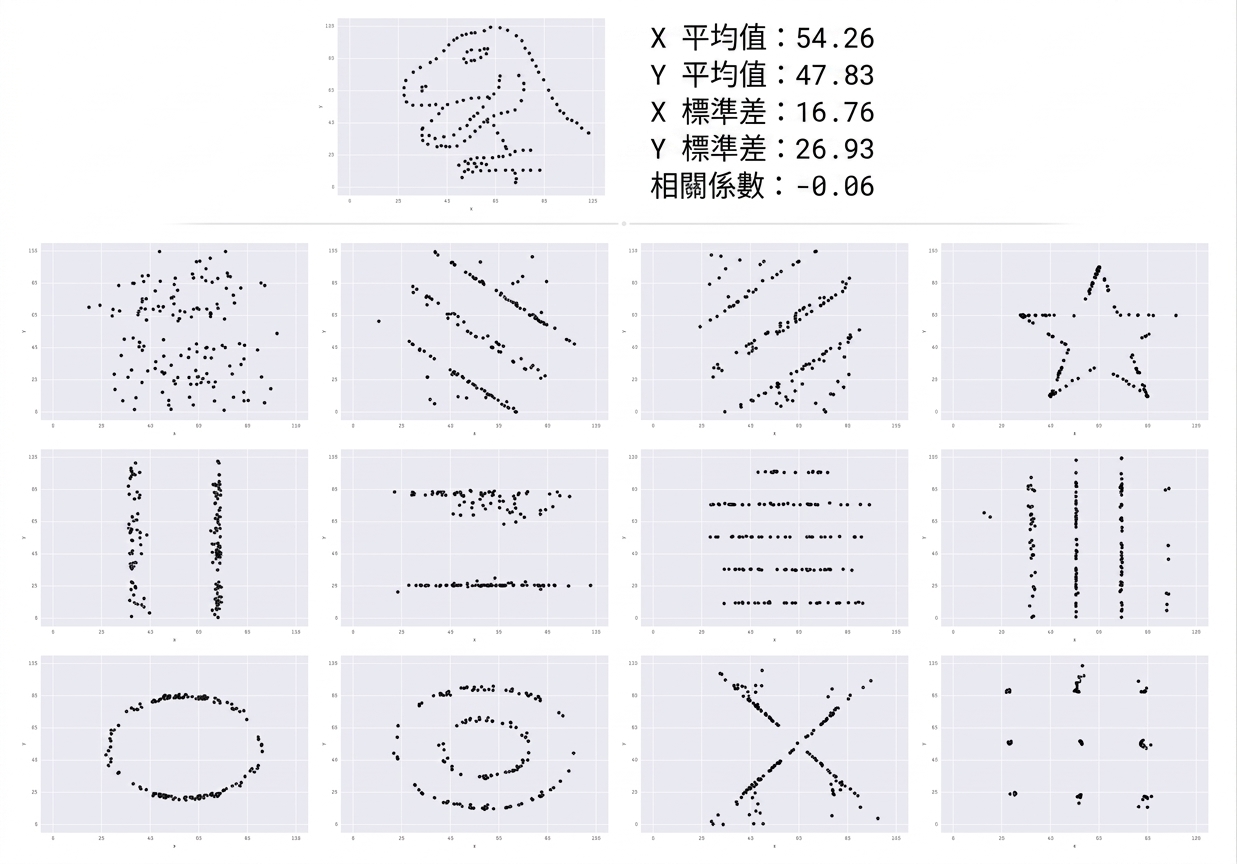
外觀可能誤導

N: 144
X Mean: 54.26
Y Mean: 47.83
X SD: 16.76
Y SD: 26.93
N: 144
X Mean: 54.26
Y Mean: 47.83
X SD: 16.76
Y SD: 26.93

  Scatter plot that looks like dinosaur


Scatter plot that looks like star

傳達資料洞見

外觀可能誤導

13 images that all look distinctly different but have the same summary information

1 https://www.autodesk.com/research/publications/same-stats-different-graphs
傳達資料洞見

一起來練習吧!

傳達資料洞見

Preparing Video For Download...