總結
Tidyverse 入門

David Robinson
Chief Data Scientist, DataCamp
用 R 轉換並視覺化資料
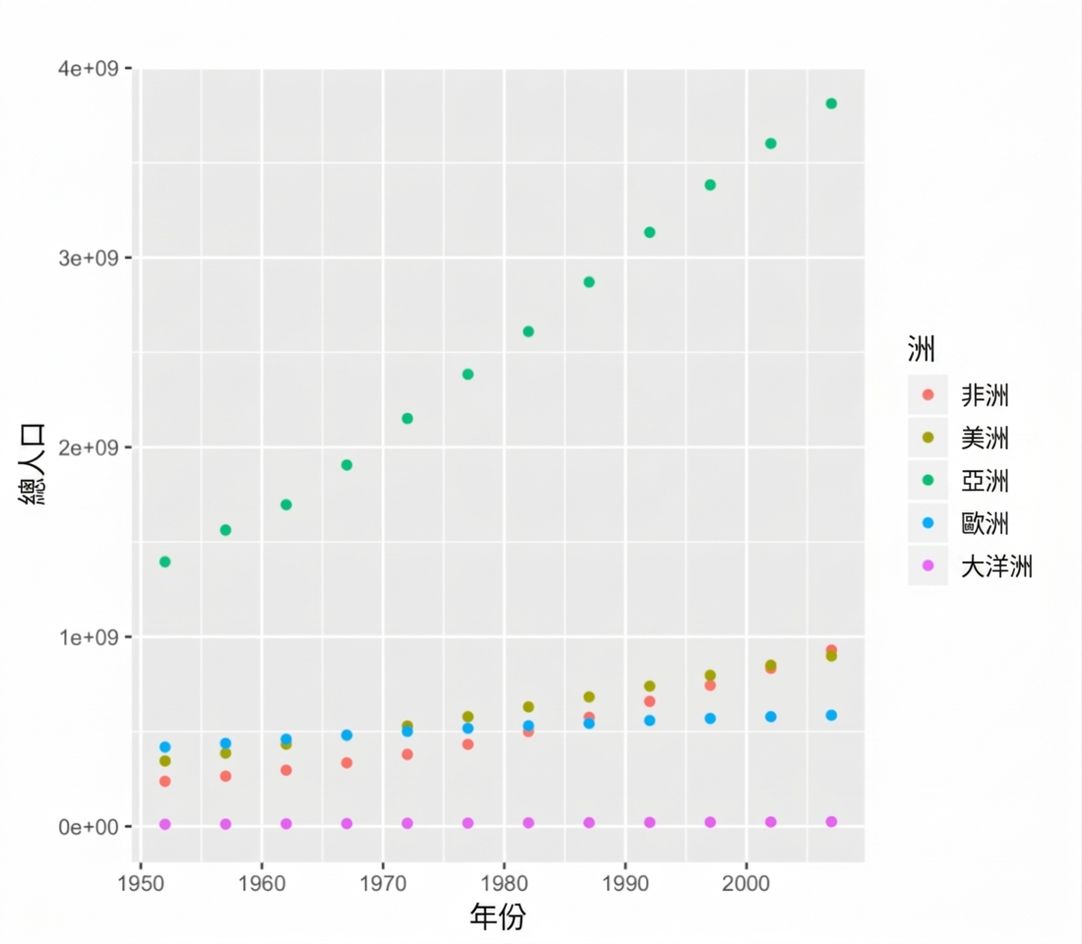
ggplot(by_year_continent, aes(x = year, y = totalPop, color = continent)) +
    geom_point() +
    expand_limits(y = 0)
Tidyverse 入門
David Robinson
Chief Data Scientist, DataCamp
ggplot(by_year_continent, aes(x = year, y = totalPop, color = continent)) +
geom_point() +
expand_limits(y = 0)

