恭喜你

Python 的探索性資料分析

George Boorman

Curriculum Manager, DataCamp

檢查與驗證

書籍評分的長條圖

books["year"] = books["year"].astype(int)
books.dtypes
name       object
author     object
rating    float64
year        int64
genre      object
dtype: object
Python 的探索性資料分析

彙總

books.groupby("genre").agg(
    mean_rating=("rating", "mean"),
    std_rating=("rating", "std"),
    median_year=("year", "median")
)
|  genre      | mean_rating | std_rating | median_year |
|-------------|-------------|------------|-------------|
|   Childrens |    4.780000 |   0.122370 |      2015.0 |
|     Fiction |    4.570229 |   0.281123 |      2013.0 |
| Non Fiction |    4.598324 |   0.179411 |      2013.0 |
Python 的探索性資料分析

處理遺漏值

print(salaries.isna().sum())
Working_Year            12
Designation             27
Experience              33
Employment_Status       31
Employee_Location       28
Company_Size            40
Remote_Working_Ratio    24
Salary_USD              60
dtype: int64
Python 的探索性資料分析

處理遺漏值

  • 刪除遺漏值


  • 以平均數、中位數、眾數補值


  • 依子群補值


salaries_dict = salaries.groupby("Experience")["Salary_USD"].median().to_dict()
salaries["Salary_USD"] = salaries["Salary_USD"].fillna(salaries["Experience"].map(salaries_dict))
Python 的探索性資料分析

分析類別資料

salaries["Job_Category"] = np.select(conditions, 
                                     job_categories, 
                                     default="Other")
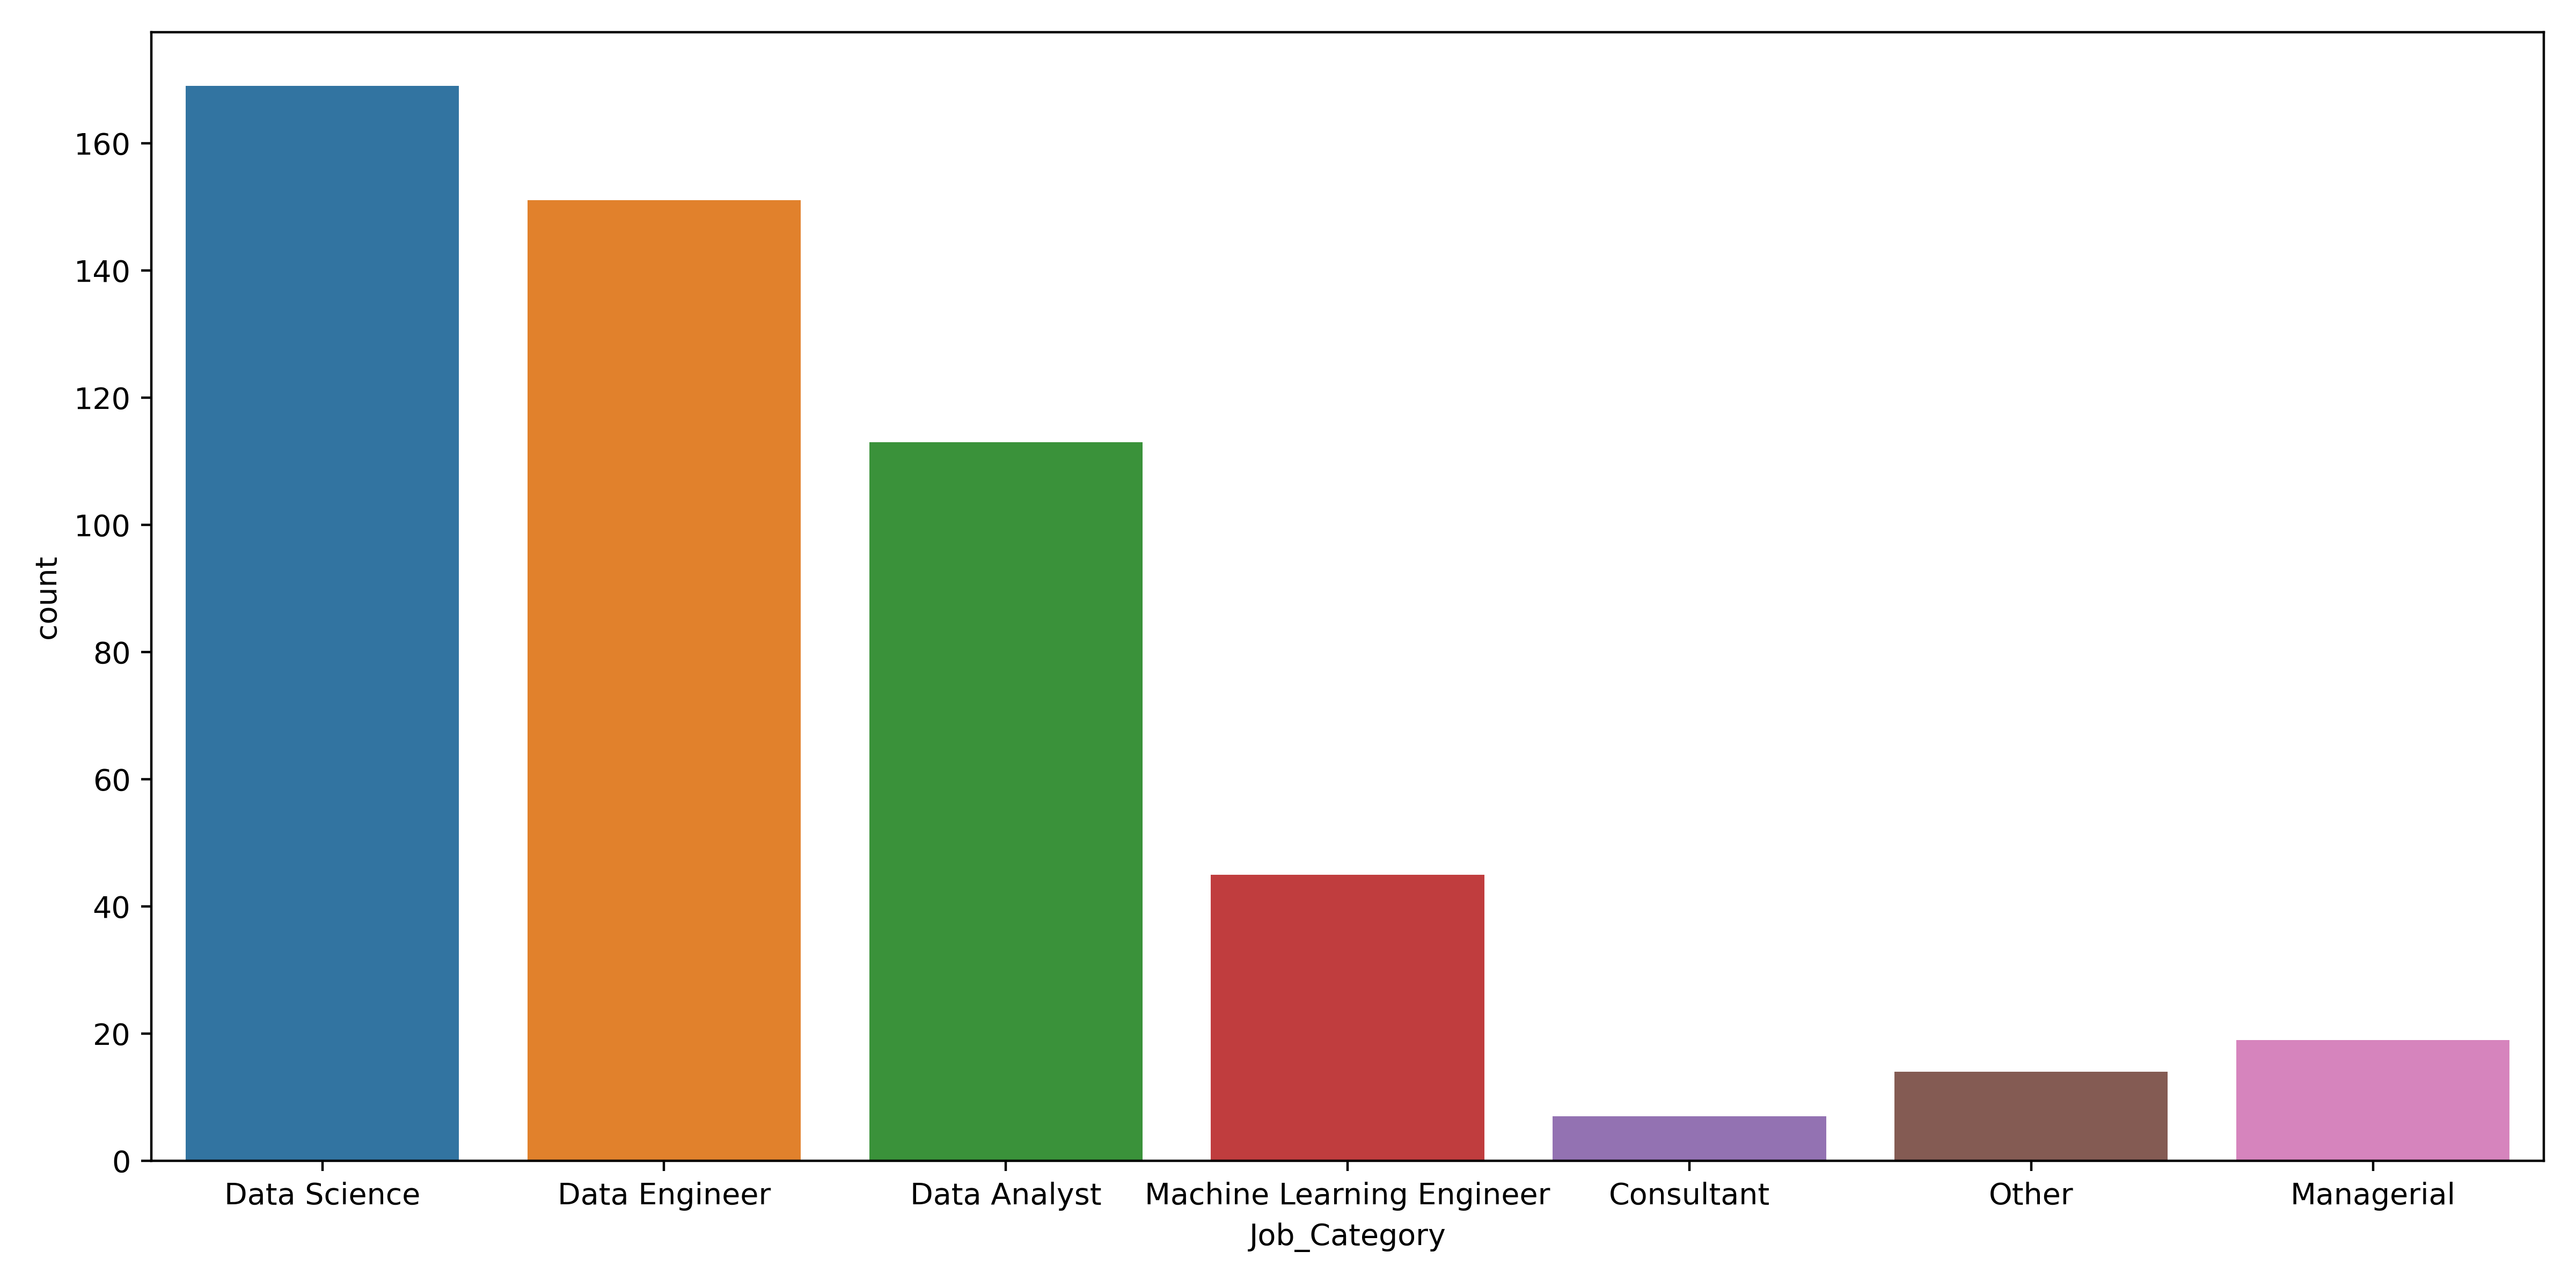
各職類別職缺數的長條圖

Python 的探索性資料分析

套用 lambda 函式

套用 lambda 函式

salaries["std_dev"] = salaries.groupby("Experience")["Salary_USD"].transform(lambda x: x.std())
Python 的探索性資料分析

處理離群值

sns.boxplot(data=salaries,
            y="Salary_USD")
plt.show()

資料專業人員薪資的盒鬚圖,盒底為第 25 百分位,中線為第 50 百分位,盒頂為第 75 百分位

Python 的探索性資料分析

時間趨勢

sns.lineplot(data=divorce, x="marriage_month", y="marriage_duration")
plt.show()

顯示結婚月份與婚姻持續時間關係的折線圖

Python 的探索性資料分析

相關性

sns.heatmap(divorce.corr(numeric_only=True), annot=True)
plt.show()

離婚相關性的熱圖

Python 的探索性資料分析

分佈

sns.kdeplot(data=divorce, x="marriage_duration", hue="education_man", cut=0)
plt.show()

以 education_man 為色相、cut 設為 0 的婚姻持續時間 KDE

Python 的探索性資料分析

交叉列聯表

pd.crosstab(planes["Source"], planes["Destination"],
            values=planes["Price"], aggfunc="median")
Destination  Banglore   Cochin   Delhi  Hyderabad  Kolkata  New Delhi
Source                                                               
Banglore          NaN      NaN  4823.0        NaN      NaN    10976.5
Chennai           NaN      NaN     NaN        NaN   3850.0        NaN
Delhi             NaN  10262.0     NaN        NaN      NaN        NaN
Kolkata        9345.0      NaN     NaN        NaN      NaN        NaN
Mumbai            NaN      NaN     NaN     3342.0      NaN        NaN
Python 的探索性資料分析

pd.cut()

提供分箱

planes["Price_Category"] = pd.cut(planes["Price"],
                                  labels=labels,
                                  bins=bins)
Python 的探索性資料分析

資料探勘偏誤(Data snooping)

不同中轉次數的相關係數熱圖

Python 的探索性資料分析

產生假設

sns.barplot(data=planes, x="Airline", y="Duration")
plt.show()

各航空公司之飛行時間的長條圖

Python 的探索性資料分析

下一步

Python 的探索性資料分析

恭喜!

Python 的探索性資料分析

Preparing Video For Download...