產生假設

Python 的探索性資料分析

George Boorman

Curriculum Manager, DataCamp

我們知道什麼?
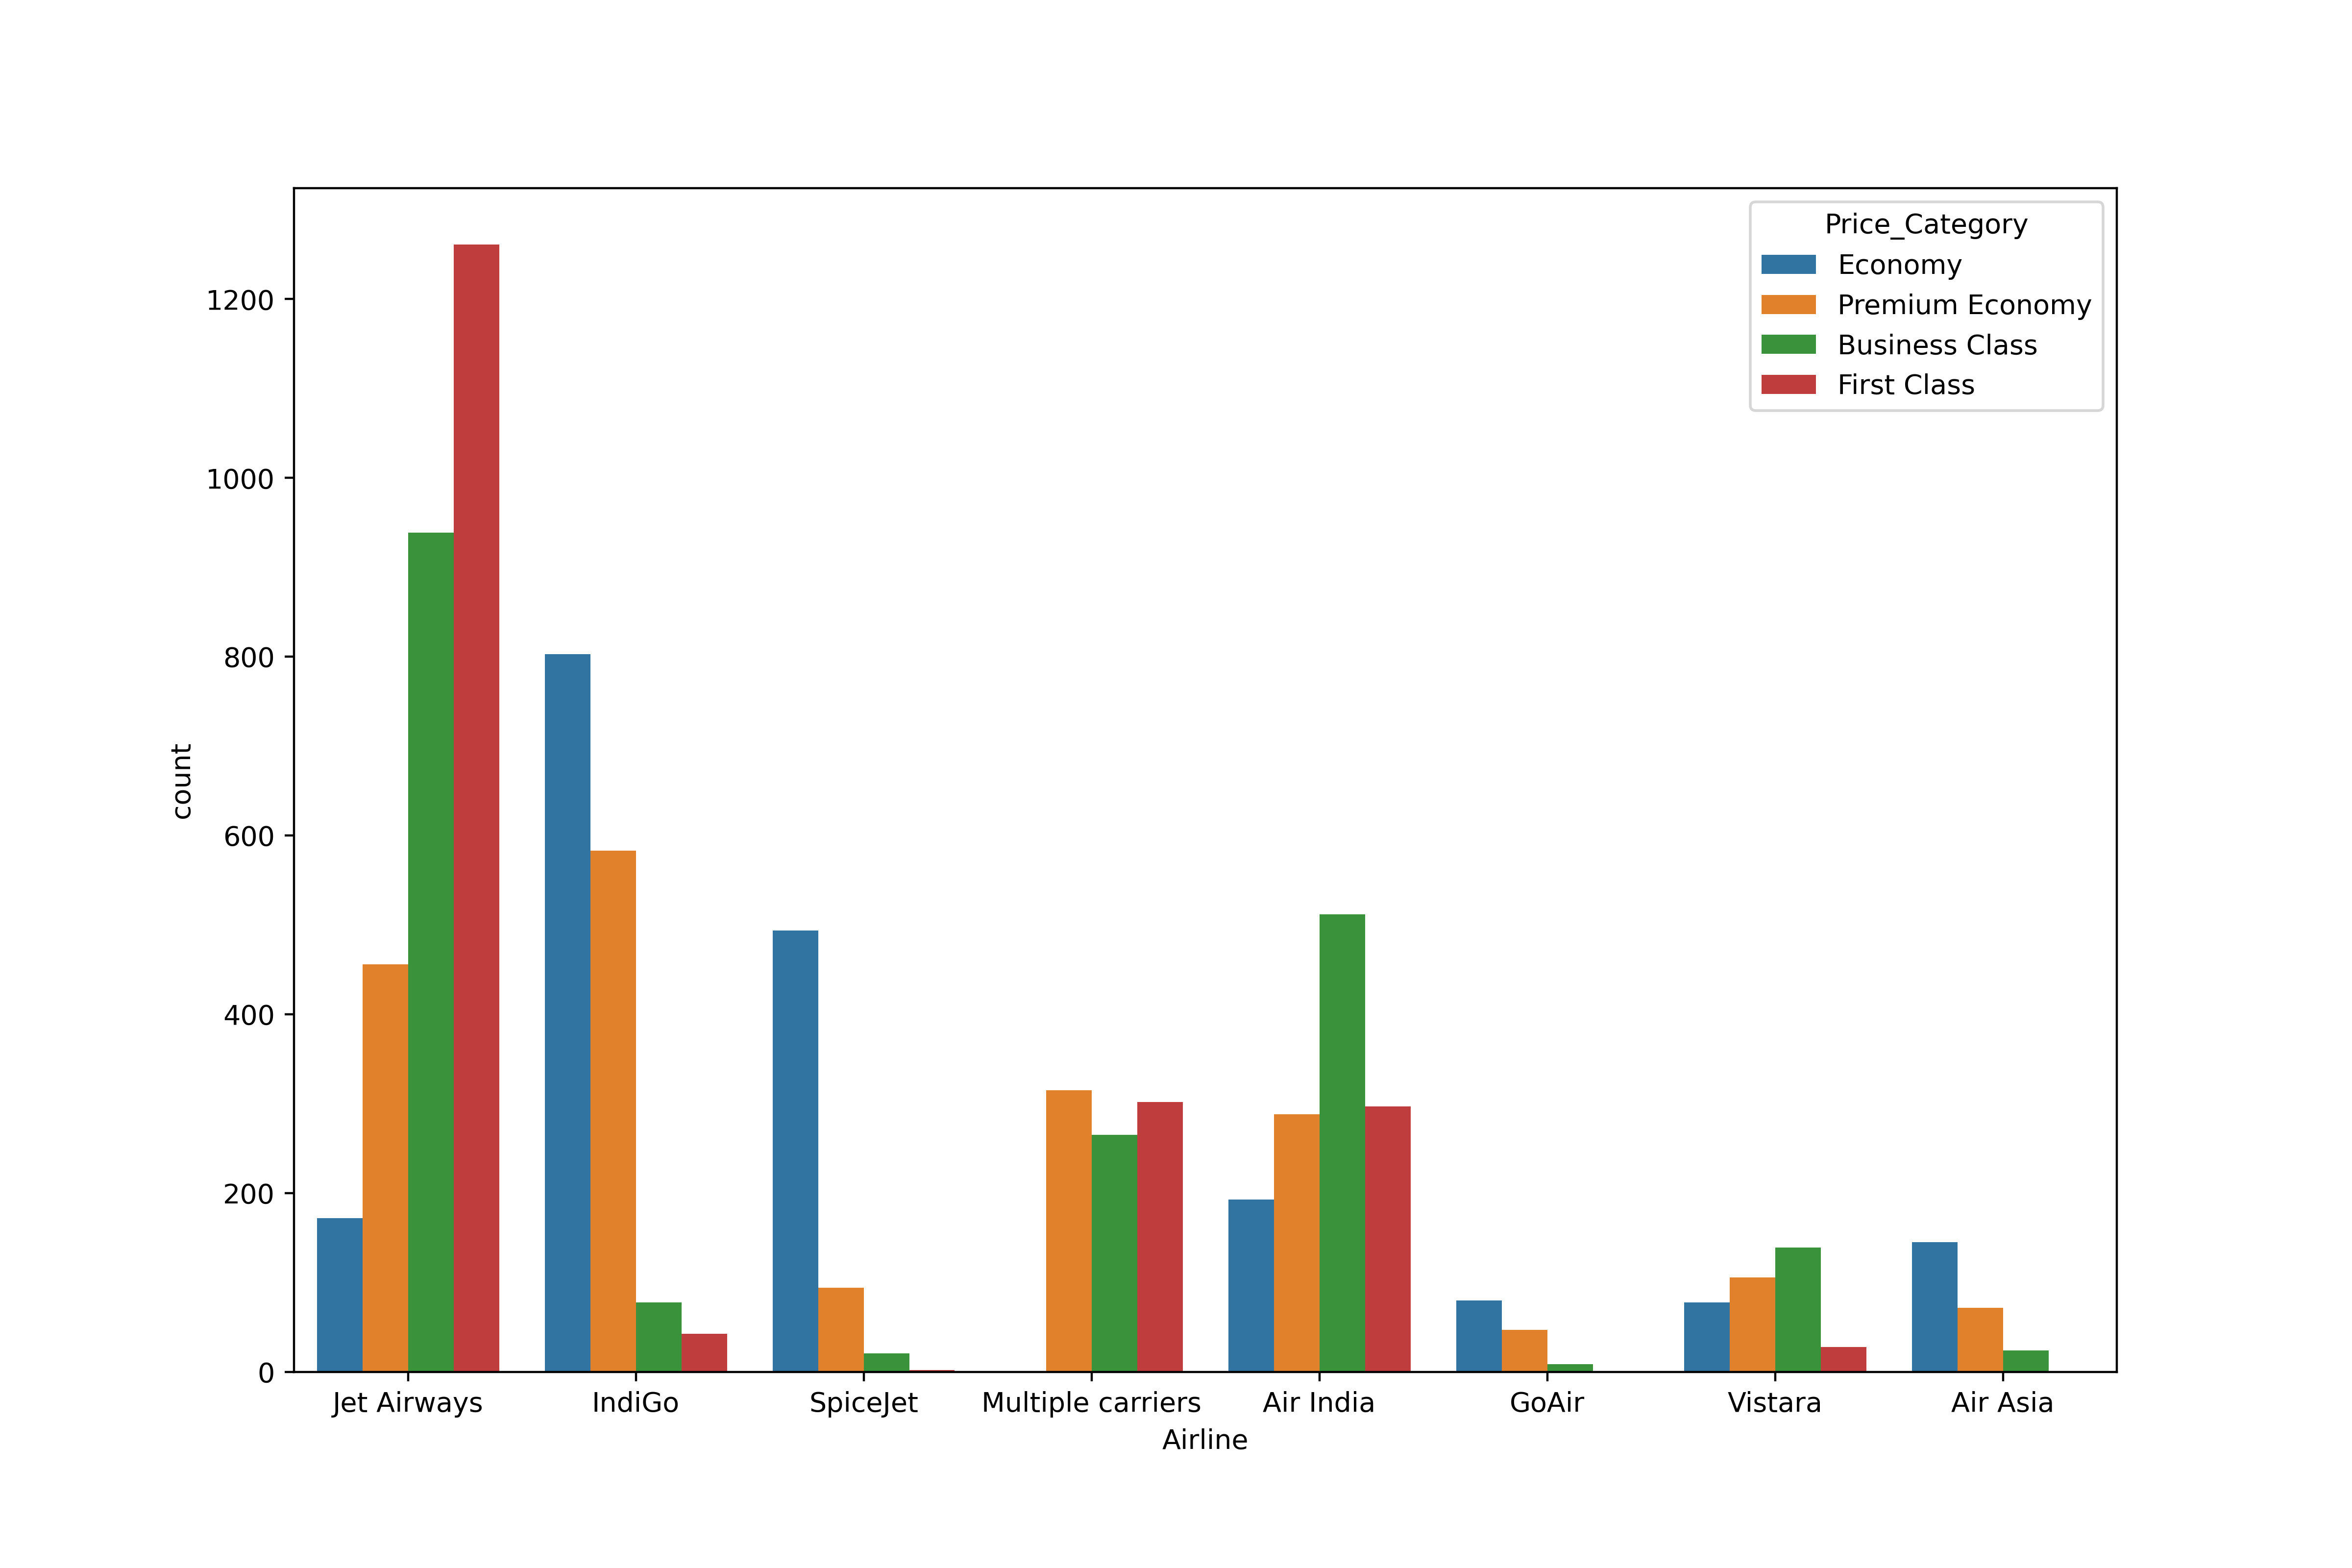
不同票價類別下,各航空公司航班數的計數圖,Jet Airways 的頭等艙機票最多

Python 的探索性資料分析

我們知道什麼?

sns.heatmap(planes.corr(numeric_only=True), annot=True)
plt.show()

顯示 planes 資料集中各變數間皮爾森相關係數的熱圖

Python 的探索性資料分析

虛假相關

sns.scatterplot(data=planes, x="Duration", y="Price", hue="Total_Stops")
plt.show()

以 Total Stops 分色的 Price 對 Duration 散佈圖

Python 的探索性資料分析

我們怎麼知道?

各停站數的相關係數熱圖

Python 的探索性資料分析

什麼是真的?

打字機顯示「Fake News」

  • 不同時間的資料會得到相同結果嗎?

  • 偵測關係、差異與模式:

    • 我們使用 Hypothesis Testing
  • 假設檢定在收集資料前需要:

    • 先提出假設或問題
    • 決定要用哪一種統計檢定
1 Image credit: https://unsplash.com/@markuswinkler
Python 的探索性資料分析

資料探勘偏誤(Data snooping)


俯瞰機場跑道的辦公室視角

放大鏡查看長條圖

Python 的探索性資料分析

產生假設

sns.barplot(data=planes, x="Airline", y="Duration")
plt.show()

各航空公司平均飛行時間的長條圖

Python 的探索性資料分析

產生假設

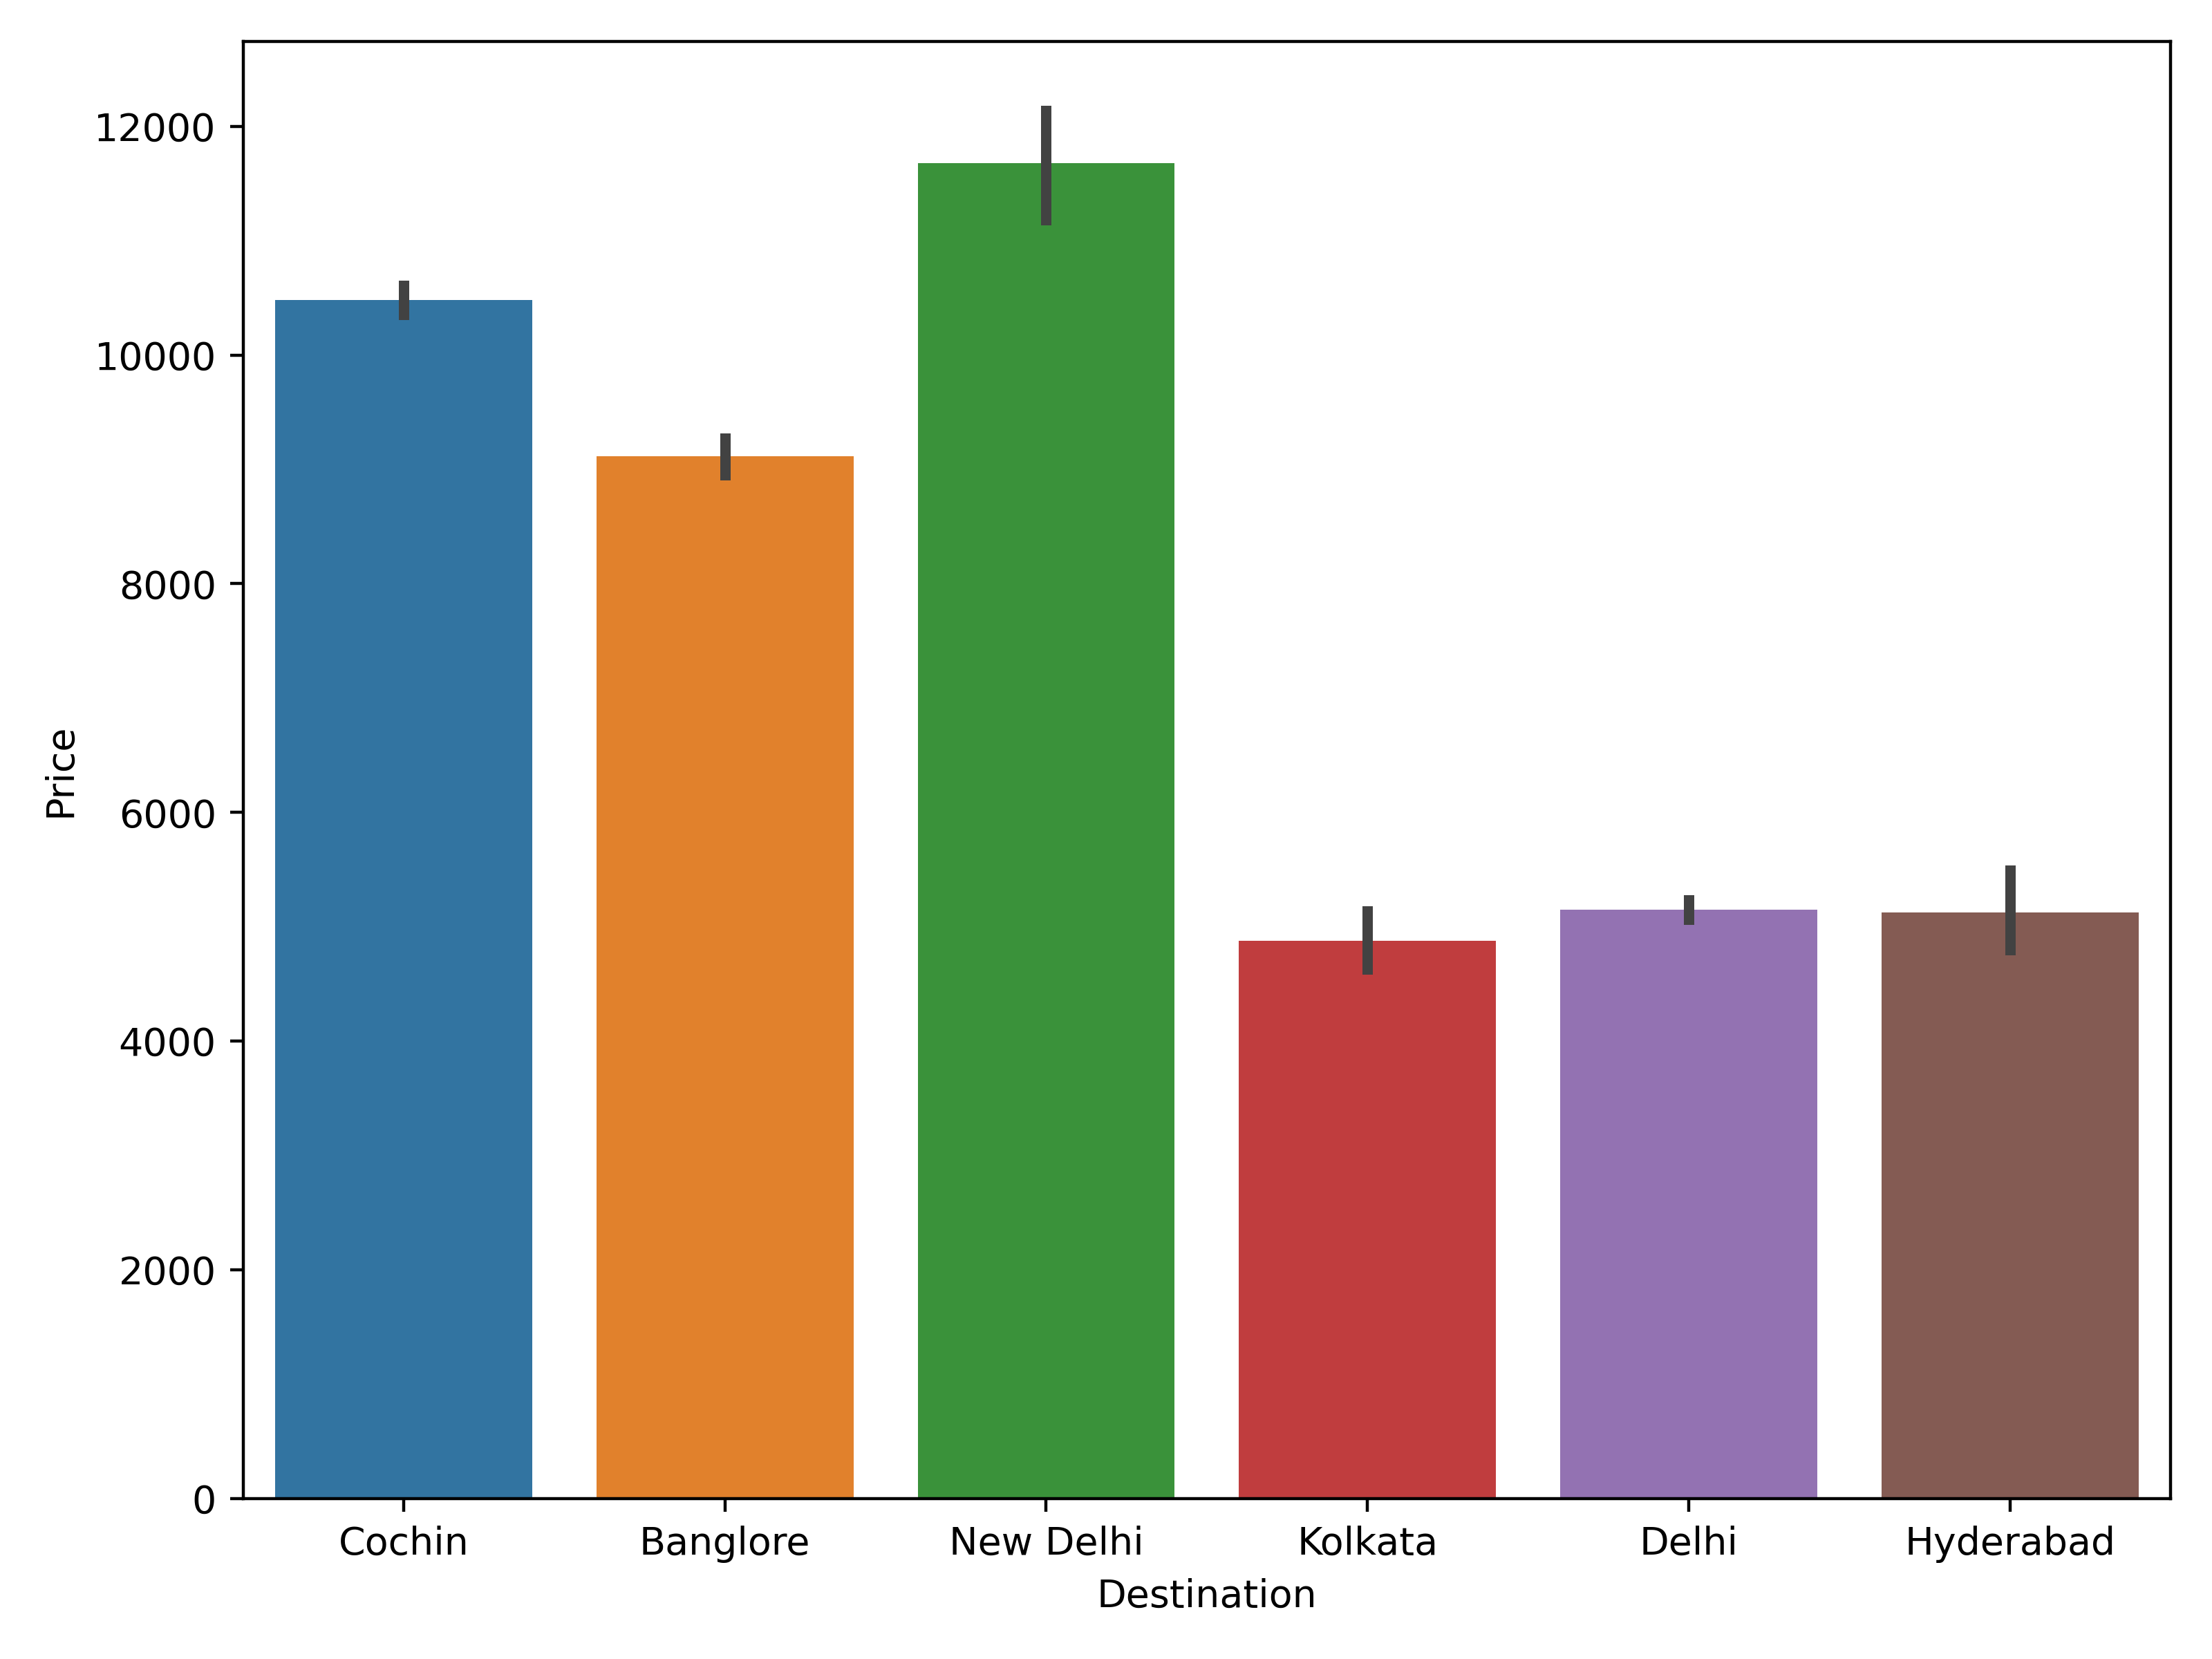
sns.barplot(data=planes, x="Destination", y="Price")
plt.show()

各目的地平均價格的長條圖

Python 的探索性資料分析

下一步

  • 設計實驗

  • 步驟包含:

    • 選擇樣本
    • 計算需要的資料點數
    • 決定要執行哪個統計檢定
Python 的探索性資料分析

一起來練習吧!

Python 的探索性資料分析

Preparing Video For Download...