用 t-SNE 製作 2D 地圖

Unsupervised Learning in Python

Benjamin Wilson

Director of Research at lateral.io

用 t-SNE 製作 2D 地圖

  • t-SNE = 「t-distributed stochastic neighbor embedding」
  • 將樣本映射到 2D(或 3D)空間
  • 近鄰關係大致保留
  • 很適合檢視資料集
Unsupervised Learning in Python

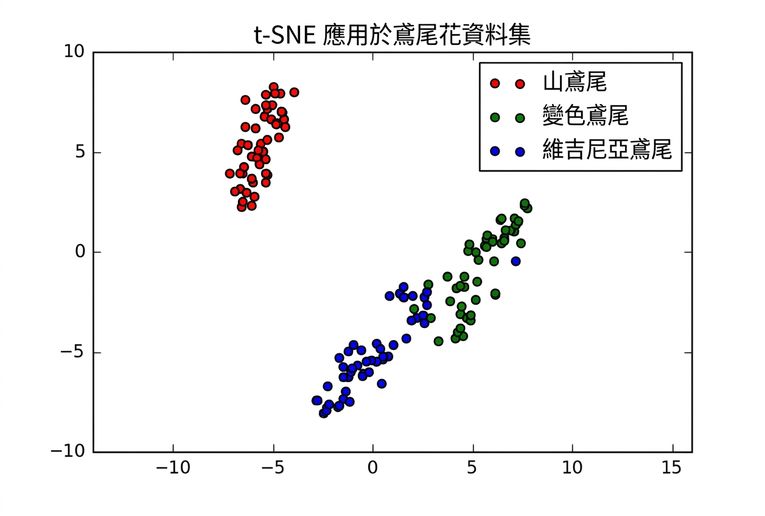
t-SNE 應用在 Iris 資料集

  • Iris 資料集有 4 個量測,因此樣本為 4 維
  • t-SNE 將樣本映射到 2D 空間
  • t-SNE 不知道物種分類
  • ……但仍大致把物種分開

對 Iris 資料集執行 t-SNE 的散佈圖

Unsupervised Learning in Python

解讀 t-SNE 散佈圖

  • 「versicolor」與「virginica」較難彼此區分
  • 與 k-means 慣性圖一致:可支持 2 群或 3 群

對 Iris 資料集執行 t-SNE 的散佈圖

Unsupervised Learning in Python

sklearn 中的 t-SNE

  • 2D NumPy 陣列 samples
print(samples)
[[ 5.   3.3  1.4  0.2]
 [ 5.   3.5  1.3  0.3]
 [ 4.9  2.4  3.3  1. ]
 [ 6.3  2.8  5.1  1.5]
 ...
 [ 4.9  3.1  1.5  0.1]]
  • 清單 species 以數字標示物種標籤(0、1、2)
print(species)
[0, 0, 1, 2, ..., 0]
Unsupervised Learning in Python

sklearn 中的 t-SNE

import matplotlib.pyplot as plt
from sklearn.manifold import TSNE
model = TSNE(learning_rate=100)

transformed = model.fit_transform(samples) xs = transformed[:,0] ys = transformed[:,1] plt.scatter(xs, ys, c=species) plt.show()
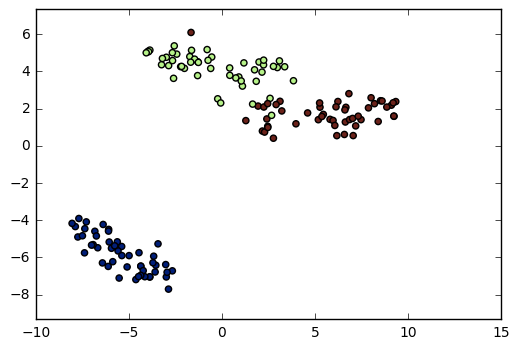
對 Iris 資料集執行 t-SNE 的散佈圖

Unsupervised Learning in Python

t-SNE 只有 fit_transform()

  • 只有 fit_transform() 方法
  • 同時擬合模型並轉換資料
  • 沒有獨立的 fit()transform()
  • 無法把新樣本擴充到既有地圖
  • 每次都要重新來過!
Unsupervised Learning in Python

t-SNE 的學習率

  • 為資料集選擇合適的學習率
  • 選錯:點會擠成一團
  • 嘗試 50 到 200 之間的值
Unsupervised Learning in Python

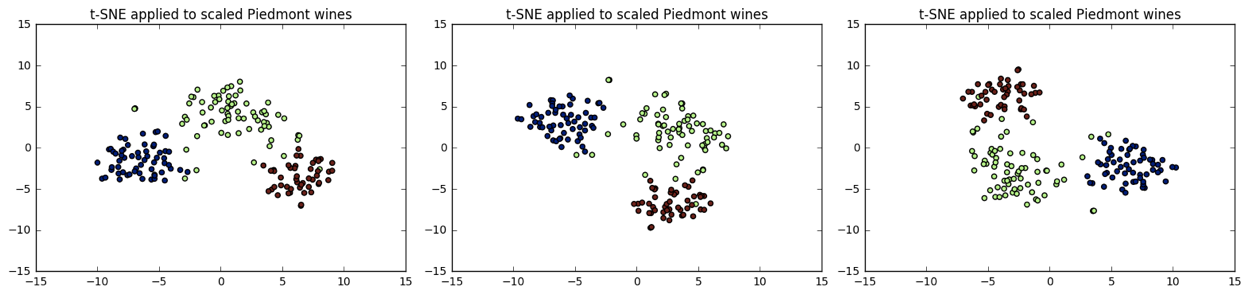
每次結果都不同

  • t-SNE 的特徵每次都不同
  • Piedmont 紅酒:跑 3 次就有 3 張不同散佈圖!
  • ……但酒款(=顏色)彼此的相對位置一致


同一紅酒資料集執行 t-SNE 3 次得到的 3 張散佈圖

Unsupervised Learning in Python

一起來練習吧!

Unsupervised Learning in Python

Preparing Video For Download...