視覺化 PCA 轉換

Unsupervised Learning in Python

Benjamin Wilson

Director of Research at lateral.io

降維

  • 更有效的儲存與計算
  • 去除資訊量低的「雜訊」特徵
  • …這些雜訊會影響預測任務,例如分類、迴歸
Unsupervised Learning in Python

主成分分析

  • PCA = 「Principal Component Analysis」
  • 核心的降維技術
  • 第一步為「去相關」(本段重點)
  • 第二步再進行降維(稍後介紹)
Unsupervised Learning in Python

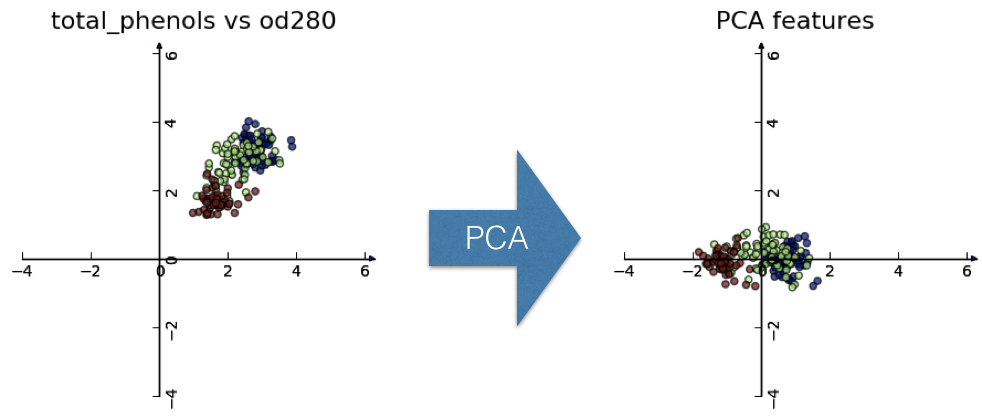
PCA 讓資料與座標軸對齊

  • 旋轉資料,使樣本與座標軸對齊
  • 平移資料,使其均值為 0
  • 不會遺失任何資訊

wines 資料的散佈圖與旋轉後座標軸

Unsupervised Learning in Python

PCA 遵循 fit/transform 模式

  • PCA 是一個 scikit-learn 元件,類似 KMeansStandardScaler
  • fit() 從資料學習轉換
  • transform() 套用已學得的轉換
  • transform() 也可套用到新資料
Unsupervised Learning in Python

使用 scikit-learn 的 PCA

  • samples = 由兩個特徵(total_phenolsod280)組成的陣列
[[ 2.8   3.92]
 ...
 [ 2.05  1.6 ]]
from sklearn.decomposition import PCA

model = PCA() model.fit(samples)
PCA()
transformed = model.transform(samples)
Unsupervised Learning in Python

PCA 特徵

  • transformed 的每一列對應一個樣本
  • 每一欄是「PCA 特徵」
  • 某一列給出該樣本的 PCA 特徵值
print(transformed)
[[  1.32771994e+00   4.51396070e-01]
 [  8.32496068e-01   2.33099664e-01]
 ...
 [ -9.33526935e-01  -4.60559297e-01]]
Unsupervised Learning in Python

PCA 特徵彼此不相關

  • 資料集的特徵常彼此相關,例如 total_phenolsod280
  • PCA 讓資料與座標軸對齊
  • 產生的 PCA 特徵彼此無線性相關(「去相關」)

wines 資料的散佈圖與旋轉後座標軸

Unsupervised Learning in Python

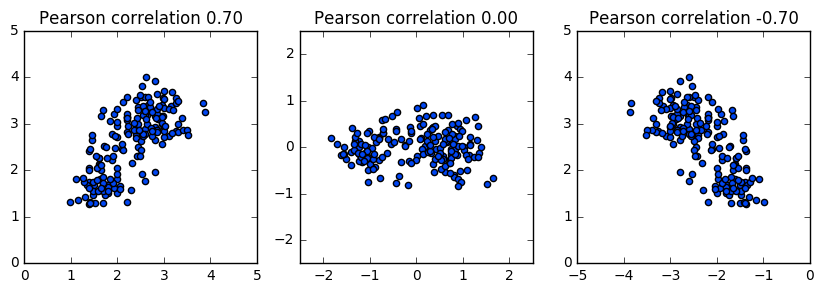
皮爾森相關係數

  • 衡量特徵間的線性相關
  • 數值介於 -1 到 1
  • 0 代表沒有線性相關

3 個散佈圖,相關係數 0.7、0、-0.7

Unsupervised Learning in Python

主成分

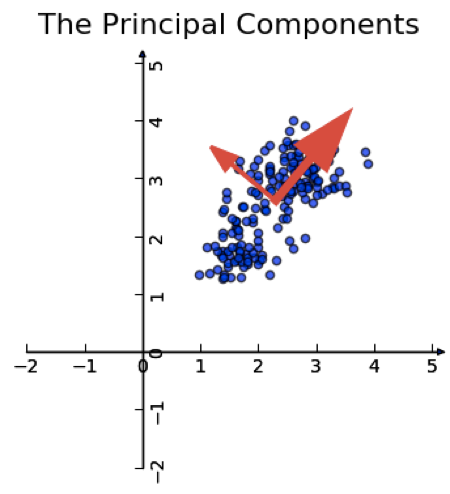
  • 「主成分」= 變異方向
  • PCA 讓主成分與座標軸對齊

wines 資料散佈圖,含 2 個紅色箭頭顯示主成分方向(旋轉後座標軸)

Unsupervised Learning in Python

主成分

  • 可由 PCA 物件的 components_ 屬性取得
  • 每一列定義自均值出發的位移
print(model.components_)
[[ 0.64116665  0.76740167]
 [-0.76740167  0.64116665]]
Unsupervised Learning in Python

一起來練習吧!

Unsupervised Learning in Python

Preparing Video For Download...