製作長條圖

Python 的資料科學入門

Hillary Green-Lerman

Lead Data Scientist, Looker

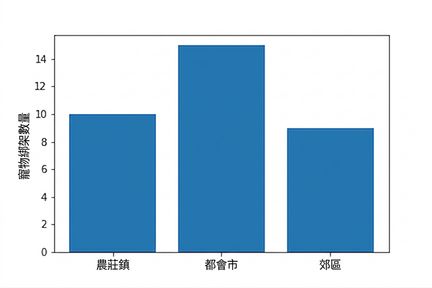
比較寵物犯罪

precinct pets_abducted
Farmburg 10
Cityville 15
Suburbia 9
plt.bar(df.precinct,
        df.pets_abducted)

plt.ylabel('Pet Abductions')
plt.show()
Python 的資料科學入門

水平長條圖

plt.barh(df.precinct,
        df.pets_abducted)

plt.ylabel('Pet Abductions')
plt.show()

Python 的資料科學入門

加入誤差棒

plt.bar(df.precinct, df.pet_abductions,
        yerr=df.error)

plt.ylabel('Pet Abductions')
plt.show()

Python 的資料科學入門

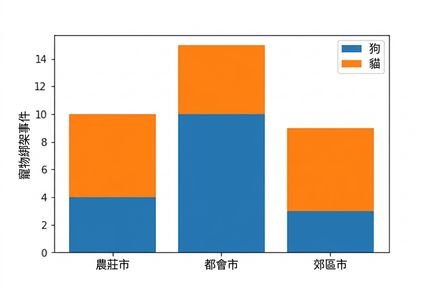
堆疊長條圖

Python 的資料科學入門

堆疊長條圖

Python 的資料科學入門

堆疊長條圖

Python 的資料科學入門

堆疊長條圖

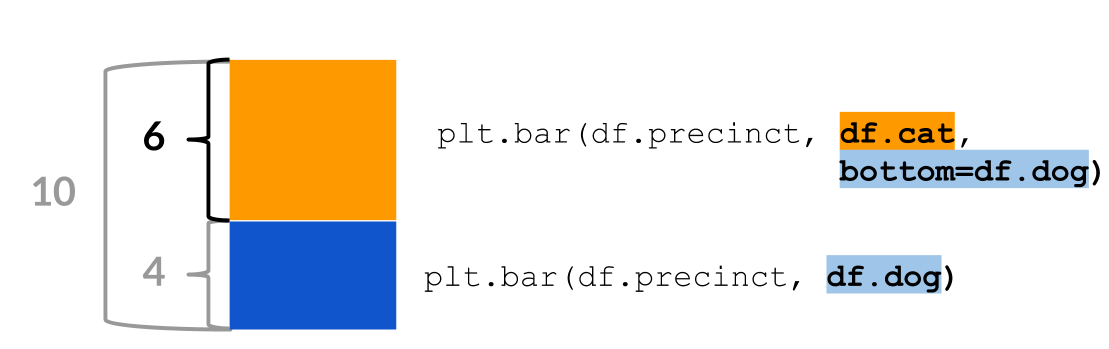
plt.bar(df.precinct, df.dog,
        label='Dog')

plt.bar(df.precinct, df.cat,
        bottom=df.dog,
        label='Cat')

plt.legend()
plt.show()

Python 的資料科學入門

一起來練習吧!

Python 的資料科學入門

Preparing Video For Download...