Python 的資料科學入門
Hillary Green-Lerman
Lead Data Scientist, Looker
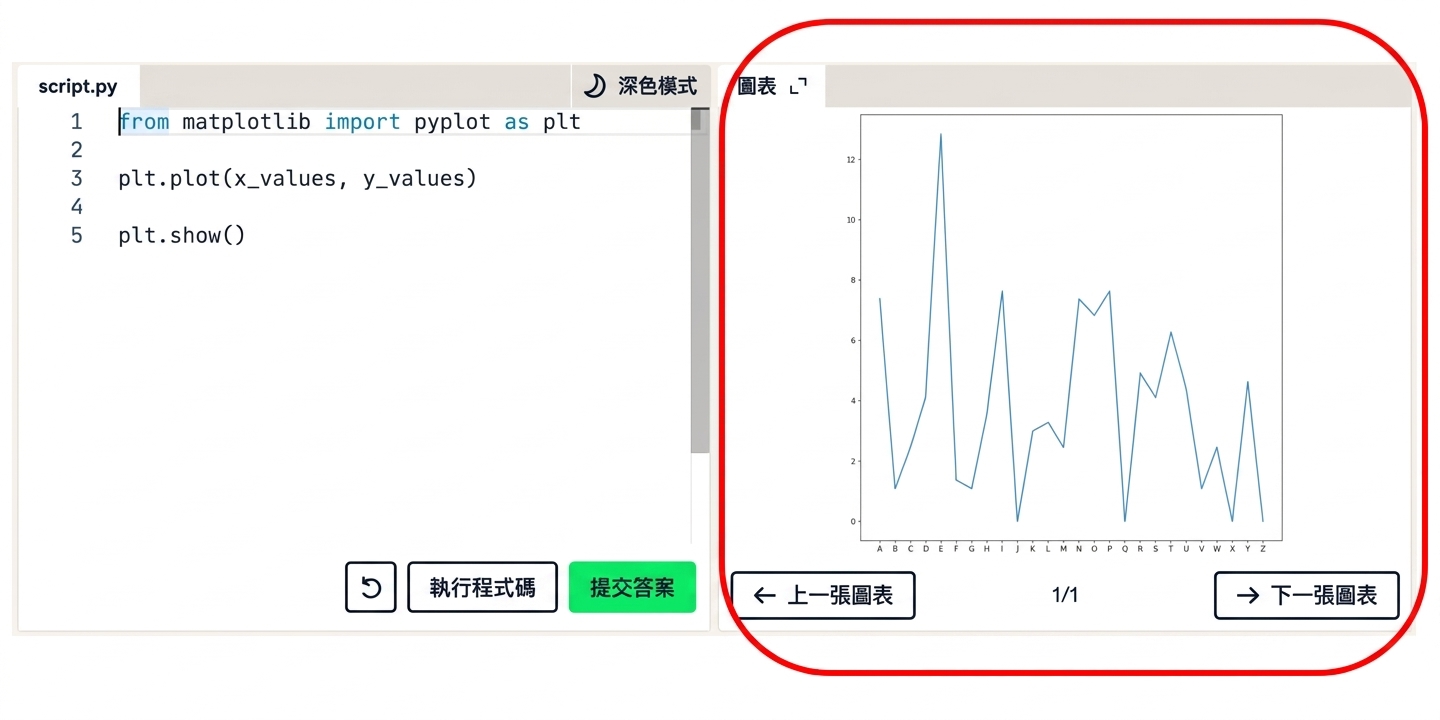
from matplotlib import pyplot as plt
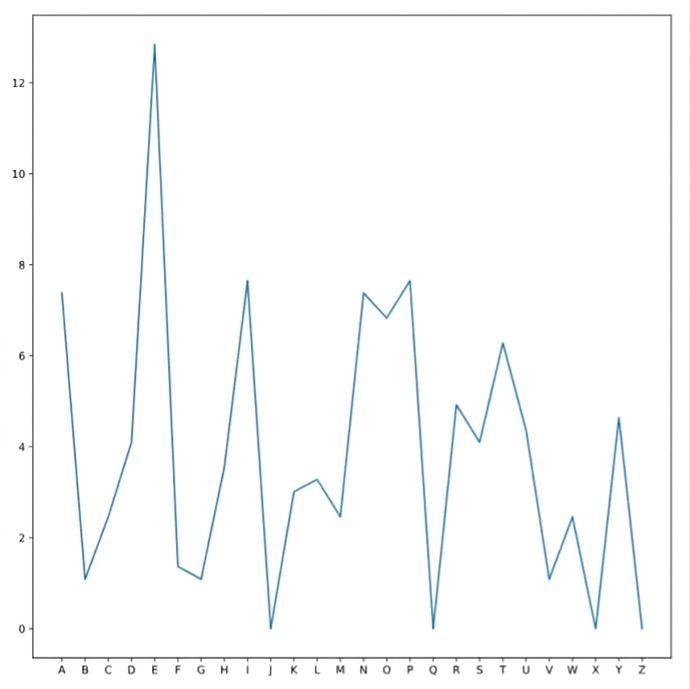
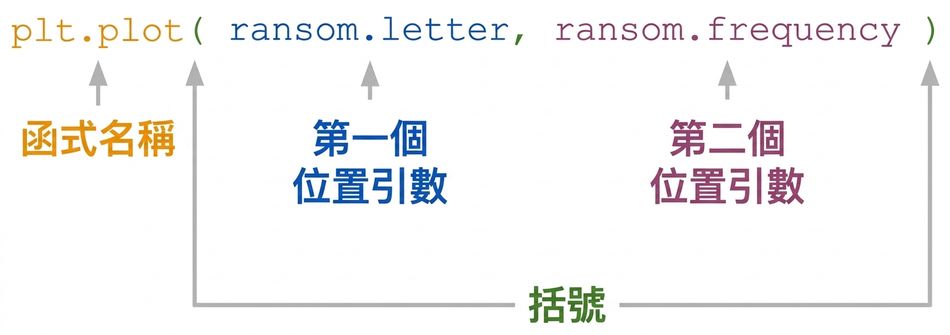
plt.plot(x_values, y_values)

plt.show()
plt.show()
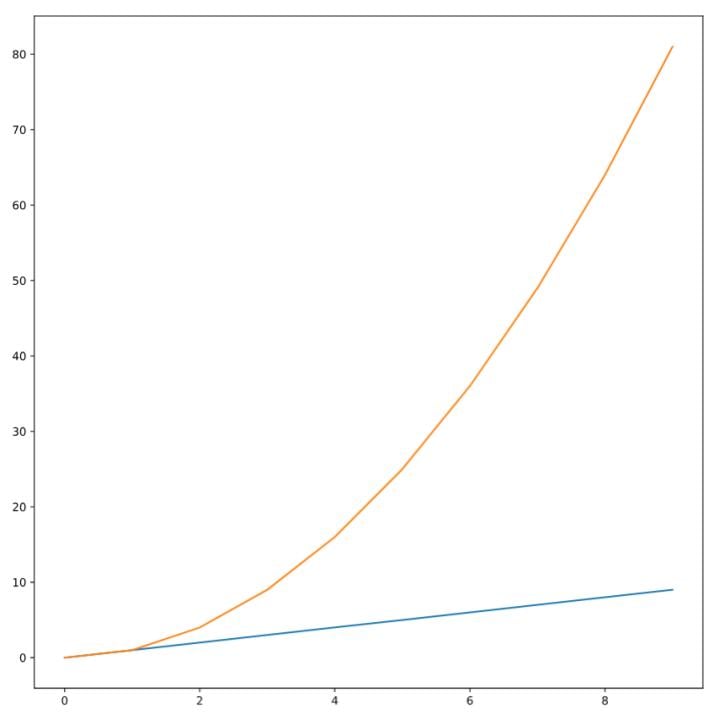
plt.plot(data1.x_values,
         data1.y_values)
plt.plot(data2.x_values,
         data2.y_values)