集中趨勢

R 統計學入門

Maggie Matsui

Content Developer, DataCamp

哺乳動物睡眠資料

msleep
# A tibble: 83 x 11
   name             genus       vore  order        sleep_total sleep_rem sleep_cycle awake
   <chr>            <chr>       <chr> <chr>              <dbl>     <dbl>       <dbl> <dbl>
 1 Cheetah          Acinonyx    carni Carnivora           12.1      NA         NA     11.9
 2 Owl monkey       Aotus       omni  Primates            17         1.8       NA      7 
 3 Mountain beaver  Aplodontia  herbi Rodentia            14.4       2.4       NA      9.6
 4 Greater short... Blarina     omni  Soricomorpha        14.9       2.3       0.133   9.1 
 5 Cow              Bos         herbi Artiodactyla         4         0.7       0.667  20  
 6 Three-toed sloth Bradypus    herbi Pilosa              14.4       2.2       0.767   9.6 
 7 Northern fur...  Callorhinus carni Carnivora            8.7       1.4       0.383  15.3 
# ... with 76 more rows, and 2 more variables: brainwt <dbl>, bodywt <dbl>
R 統計學入門

直方圖

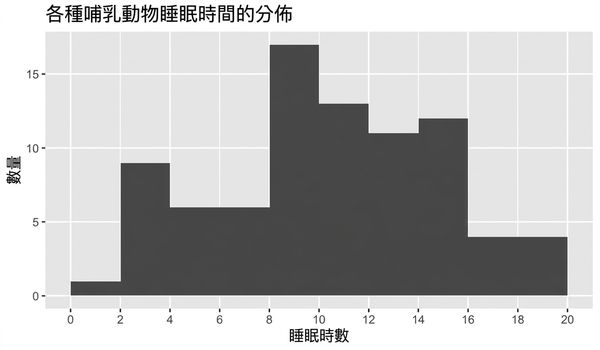
哺乳動物睡眠時間的直方圖

R 統計學入門

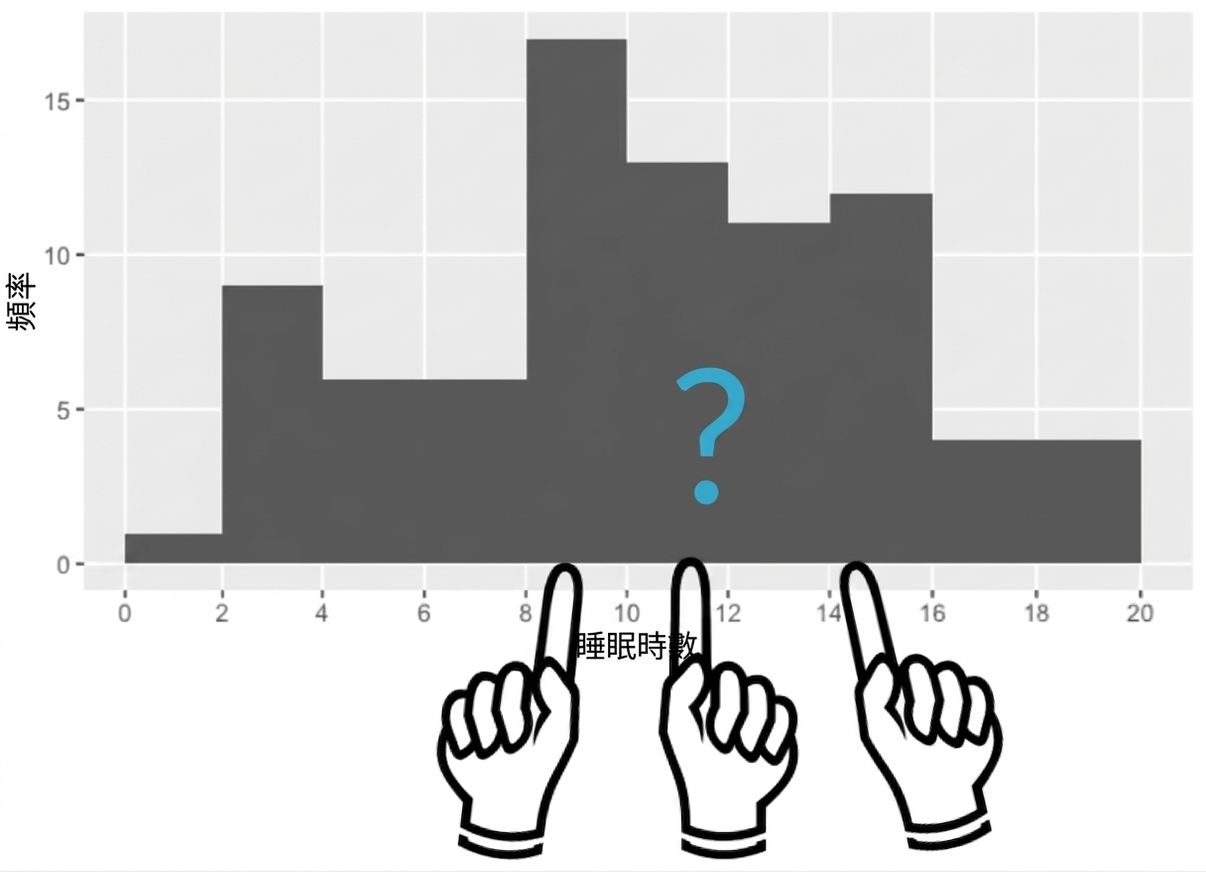
這個資料集的哺乳動物通常睡多久?

典型值是什麼?

資料的中心在哪裡?

  • 平均數
  • 中位數
  • 眾數

帶問號與指向手勢的直方圖

R 統計學入門

集中趨勢:平均數

  name                       sleep_total
1 Cheetah                           12.1
2 Owl monkey                        17.0 
3 Mountain beaver                   14.4
4 Greater short-tailed shrew        14.9
...

$$\text{Mean sleep time}=\frac{12.1 + 17.0 + 14.4 + 14.9 + ...}{83} = 10.43$$

mean(msleep$sleep_total)
10.43373
R 統計學入門

集中趨勢:中位數

sort(msleep$sleep_total)
 [1]  1.9  2.7  2.9  3.0  3.1  3.3  3.5  3.8  3.9  4.0  4.4  5.2  5.3  5.3  5.4  5.6  6.2
...
[52] 11.5 12.1 12.5 12.5 12.5 12.5 12.8 12.8 13.0 13.5 13.7 13.8 14.2 14.3 14.4 14.4 14.5
[69] 14.6 14.9 14.9 15.6 15.8 15.8 15.9 16.6 17.0 17.4 18.0 18.1 19.4 19.7 19.9


sort(msleep$sleep_total)[42]
10.1


median(msleep$sleep_total)
10.1
R 統計學入門

集中趨勢:眾數

最常見的值

# 計數並依 'sleep_total' 由大到小排序
msleep %>% count(sleep_total, sort = TRUE)
   sleep_total     n
         <dbl> <int>
 1        12.5     4
 2        10.1     3
 3         5.3     2
 4         6.3     2
 ...


# 計數並依 'vore' 由大到小排序
msleep %>% count(vore, sort = TRUE)
  vore        n
  <chr>   <int>
1 herbi      32
2 omni       20
3 carni      19
4 NA          7
5 insecti     5
R 統計學入門

過濾出食蟲動物的資料

msleep %>% 
  filter(vore == "insecti")
  name                  genus        vore    order        sleep_total
  <chr>                 <chr>        <chr>   <chr>              <dbl>
1 Big brown bat         Eptesicus    insecti Chiroptera          19.7
2 Little brown bat      Myotis       insecti Chiroptera          19.9
3 Giant armadillo       Priodontes   insecti Cingulata           18.1
4 Eastern american mole Scalopus     insecti Soricomorpha         8.4
R 統計學入門

食蟲動物的睡眠統計摘要

msleep %>% 
  filter(vore == "insecti") %>%

summarize(mean_sleep = mean(sleep_total), median_sleep = median(sleep_total))
  mean_sleep median_sleep
       <dbl>        <dbl> 
1      16.52         18.9
R 統計學入門

加入離群值

msleep %>% 
  filter(vore == "insecti")
  name                  genus        vore    order        sleep_total
  <chr>                 <chr>        <chr>   <chr>              <dbl>
1 Big brown bat         Eptesicus    insecti Chiroptera          19.7
2 Little brown bat      Myotis       insecti Chiroptera          19.9
3 Giant armadillo       Priodontes   insecti Cingulata           18.1
4 Eastern american mole Scalopus     insecti Soricomorpha         8.4
5 Mystery insectivore   ...          ...     ...                  0.0
R 統計學入門

加入離群值後的摘要統計

msleep %>% 
  filter(vore == "insecti") %>%

summarize(mean_sleep = mean(sleep_total), median_sleep = median(sleep_total))
  mean_sleep median_sleep
       <dbl>        <dbl>
1      13.22         18.1

平均數: 16.5 → 13.2

中位數: 18.9 → 18.1

R 統計學入門

該用哪個指標?

# 建立 insecti 的直方圖
msleep %>% 
  filter(vore == "insecti") %>%
  ggplot(aes(insecti)) +
    geom_histogram()

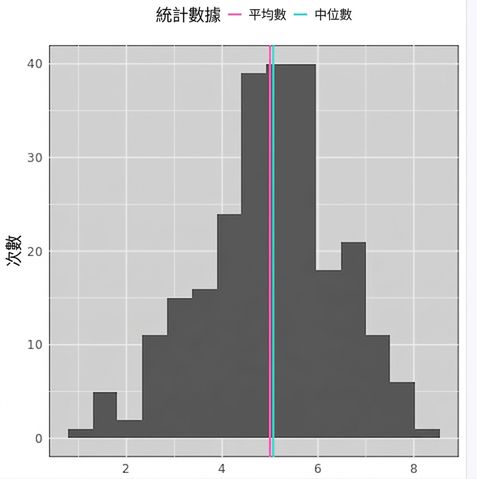
一個鐘形分佈的直方圖,中央紅藍兩線相近。紅線代表平均數,藍線代表中位數。

R 統計學入門

偏態

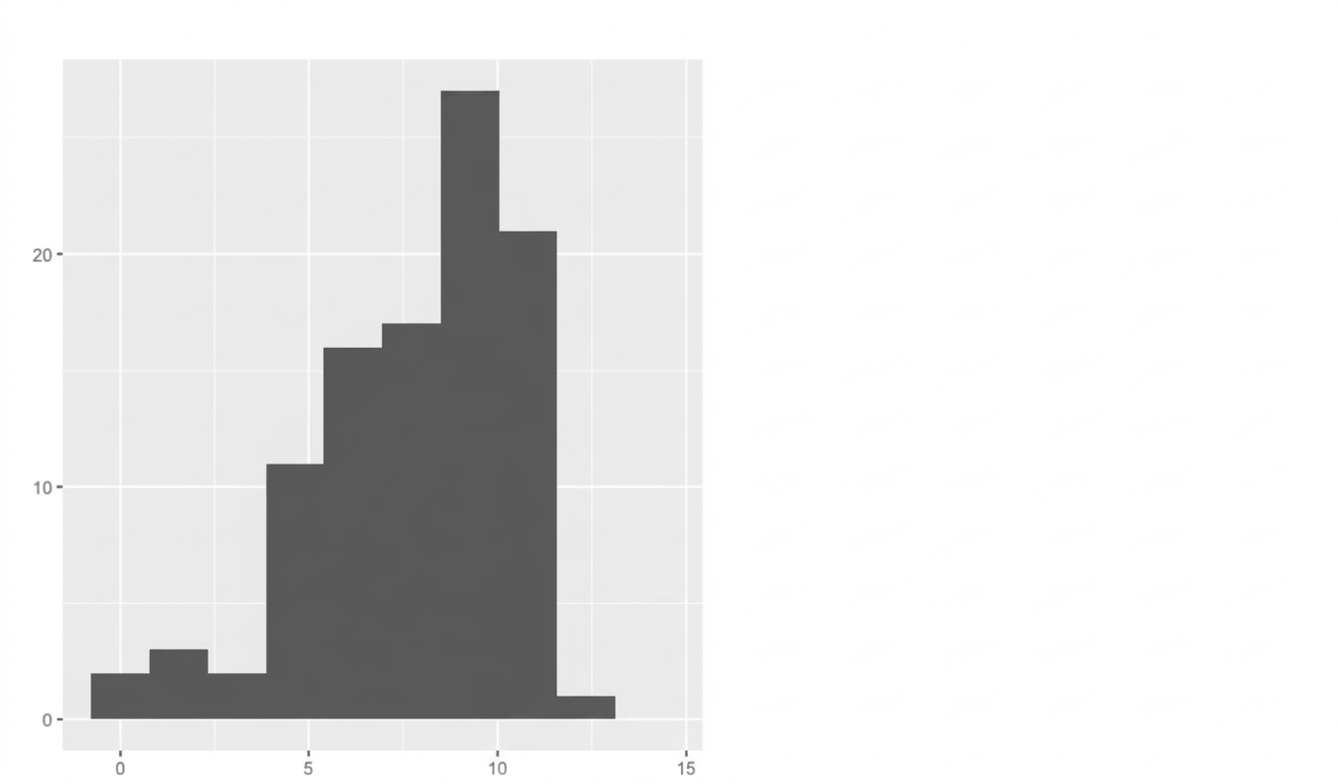
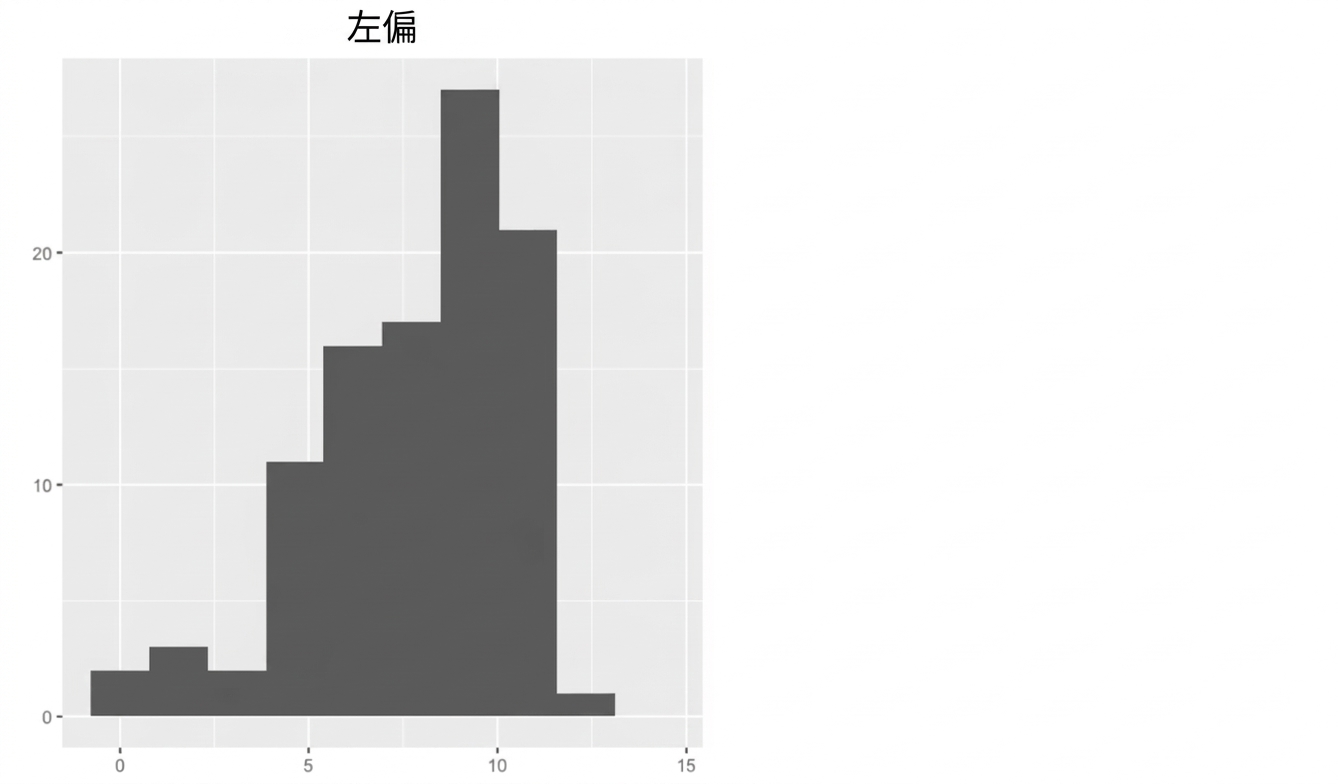
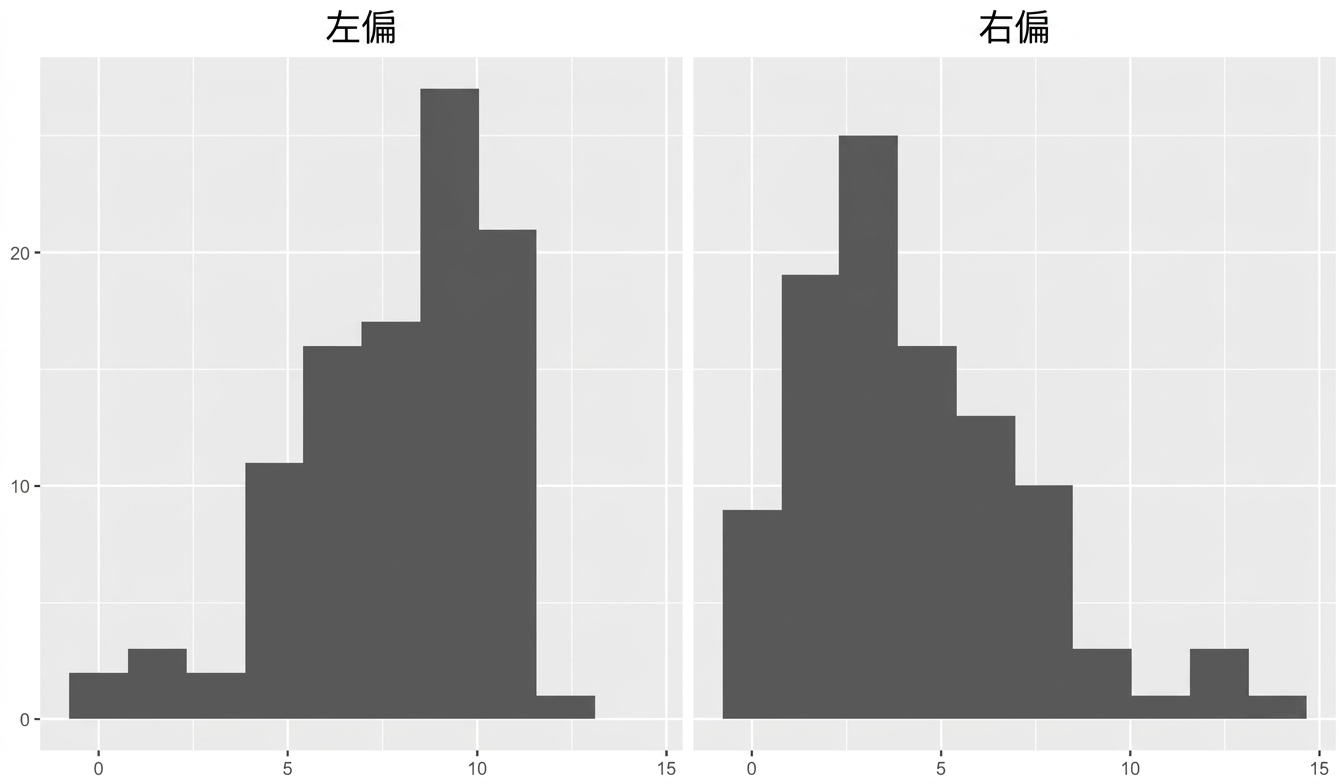
直方圖:左側值較少,往右值逐漸增加。

R 統計學入門

偏態

直方圖:標題為 Left-skewed,左尾較長、右側值較多。

R 統計學入門

偏態

直方圖:標題為 Right-skewed,右尾較長、左側值較多。

R 統計學入門

該用哪個指標?

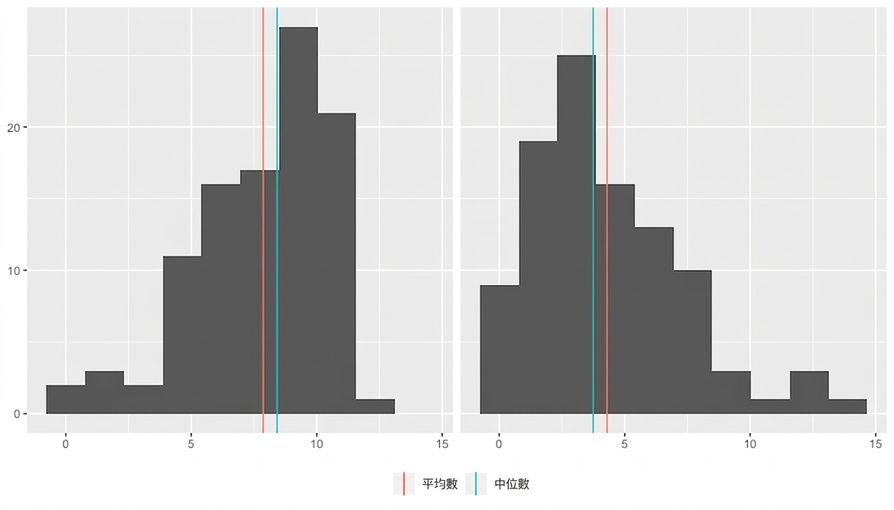
沿用前面兩張直方圖,加入平均數與中位數的紅藍線。在左偏資料中,平均數小於中位數;在右偏資料中,平均數大於中位數。

R 統計學入門

一起來練習吧!

R 統計學入門

Preparing Video For Download...