R 統計學入門
Maggie Matsui
Content Developer, DataCamp

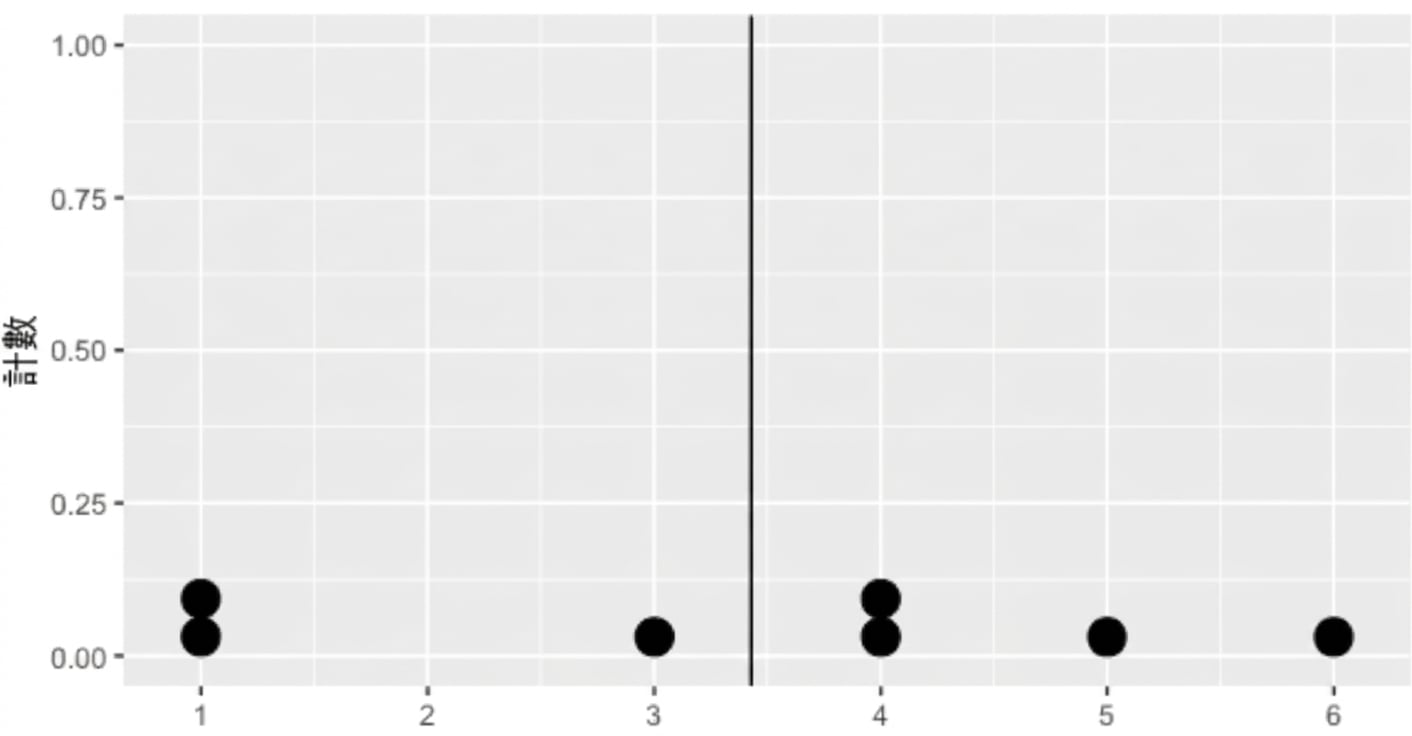
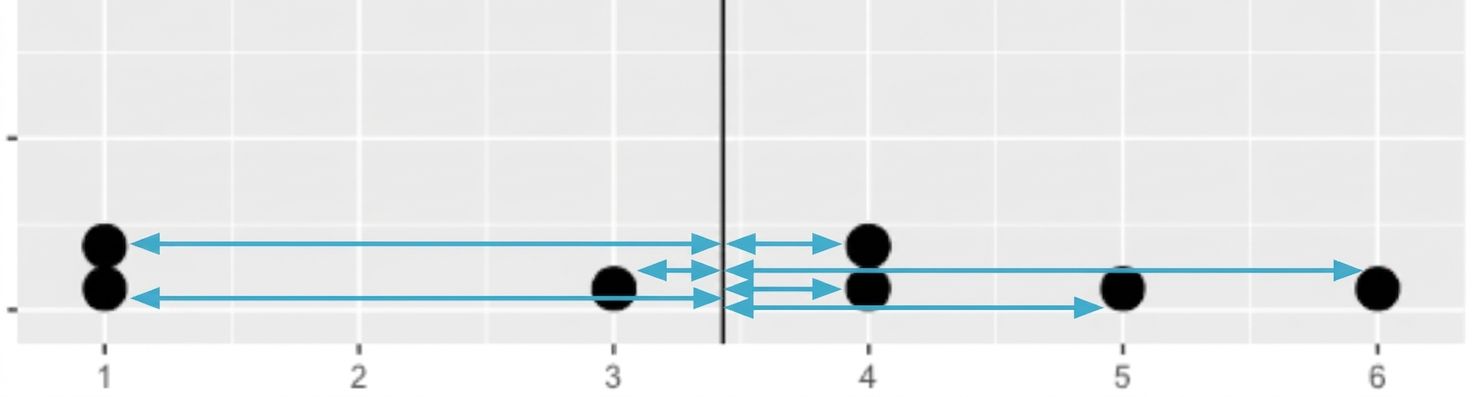
每個資料點到平均數的平均距離


dists <- msleep$sleep_total - mean(msleep$sleep_total)
dists
1.66626506 6.56626506 ... -4.13373494 2.06626506 -0.63373494
squared_dists <- (dists)^2
2.776439251 43.115836841 ... 17.087764552 4.269451299 0.401619974
sum_sq_dists <- sum(squared_dists)
sum_sq_dists
1624.066
sum_sq_dists/82
19.80568
var(msleep$sleep_total)
19.80568
sqrt(var(msleep$sleep_total))
4.450357
# Standard deviation of 'sleep_total'
sd(msleep$sleep_total)
4.450357
dists <- msleep$sleep_total - mean(msleep$sleep_total)
mean(abs(dists))
3.566701
標準差 vs. 平均絕對離差
quantile(msleep$sleep_total)
0% 25% 50% 75% 100%
1.90 7.85 10.10 13.75 19.90
第二四分位/第 50 百分位 = 中位數
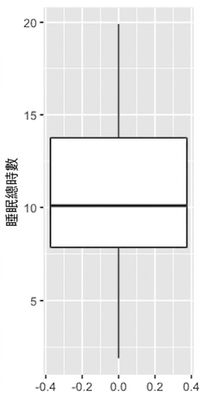
ggplot(msleep, aes(y = sleep_total)) +
geom_boxplot()

quantile(msleep$sleep_total, probs = c(0, 0.2, 0.4, 0.6, 0.8, 1))
0% 20% 40% 60% 80% 100%
1.90 6.24 9.48 11.14 14.40 19.90
seq(from, to, by)
quantile(msleep$sleep_total, probs = seq(0, 1, 0.2))
0% 20% 40% 60% 80% 100%
1.90 6.24 9.48 11.14 14.40 19.90
盒狀圖中箱體的高度
iqr = quantile(msleep$sleep_total, 0.75) - quantile(msleep$sleep_total, 0.25)
iqr
75%
5.9
離群值: 與其他資料明顯不同的資料點
如何判定「明顯不同」?若資料點符合下列任一條件,即為離群值:
iqr <- quantile(msleep$bodywt, 0.75) - quantile(msleep$bodywt, 0.25)lower_threshold <- quantile(msleep$bodywt, 0.25) - 1.5 * iqr upper_threshold<- quantile(msleep$bodywt, 0.75) + 1.5 * iqr
msleep %>% filter(bodywt < lower_threshold | bodywt > upper_threshold ) %>%
select(name, vore, sleep_total, bodywt)
# A tibble: 11 x 4
name vore sleep_total bodywt
<chr> <chr> <dbl> <dbl>
1 Cow herbi 4 600
2 Asian elephant herbi 3.9 2547
3 Horse herbi 2.9 521
...
R 統計學入門