分群簡介

使用 PySpark 的 Big Data 基礎

Upendra Devisetty

Science Analyst, CyVerse

什麼是分群?

  • 分群是無監督式學習,用來將資料集合成群組

  • 目前 PySpark MLlib 支援以下分群模型

    • K-means
    • Gaussian mixture
    • Power iteration clustering(PIC)
    • Bisecting k-means
    • Streaming k-means
使用 PySpark 的 Big Data 基礎

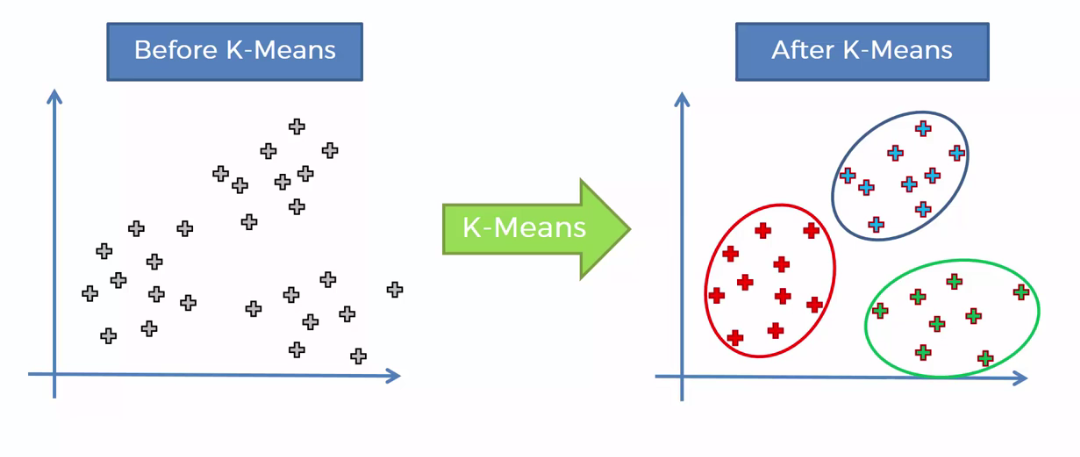
K-means 分群

  • K-means 是最常見的分群方法

使用 PySpark 的 Big Data 基礎

使用 Spark MLLib 的 K-means

RDD = sc.textFile("WineData.csv"). \
       map(lambda x: x.split(",")).\
       map(lambda x: [float(x[0]), float(x[1])])
RDD.take(5)
[[14.23, 2.43], [13.2, 2.14], [13.16, 2.67], [14.37, 2.5], [13.24, 2.87]]
使用 PySpark 的 Big Data 基礎

訓練 K-means 分群模型

  • 訓練 K-means 模型可使用 KMeans.train() 方法
from pyspark.mllib.clustering import KMeans
model = KMeans.train(RDD, k = 2, maxIterations = 10)
model.clusterCenters
[array([12.25573171,  2.28939024]), array([13.636875  ,  2.43239583])]
使用 PySpark 的 Big Data 基礎

評估 K-means 模型

from math import sqrt
def error(point):
    center = model.centers[model.predict(point)]
    return sqrt(sum([x**2 for x in (point - center)]))
WSSSE = RDD.map(lambda point: error(point)).reduce(lambda x, y: x + y)
print("Within Set Sum of Squared Error = " + str(WSSSE))
Within Set Sum of Squared Error = 77.96236420499056
使用 PySpark 的 Big Data 基礎

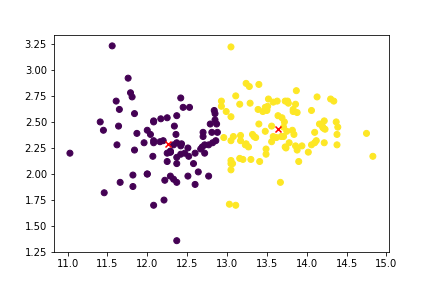
視覺化 K-means 叢集

使用 PySpark 的 Big Data 基礎

視覺化叢集

wine_data_df = spark.createDataFrame(RDD, schema=["col1", "col2"])
wine_data_df_pandas = wine_data_df.toPandas()
cluster_centers_pandas = pd.DataFrame(model.clusterCenters, columns=["col1", "col2"])
cluster_centers_pandas.head()
plt.scatter(wine_data_df_pandas["col1"], wine_data_df_pandas["col2"]);
plt.scatter(cluster_centers_pandas["col1"], cluster_centers_pandas["col2"], color="red", marker="x");
使用 PySpark 的 Big Data 基礎

分群練習

使用 PySpark 的 Big Data 基礎

Preparing Video For Download...