以資料驅動的商業決策
Ted Kwartler
Data Dude
$$

| Q1(整體滿意度) | Q2 | Q3 | Q4 | |
|---|---|---|---|---|
| Customer-1 | 1 | 5 | 5 | 5 |
| Customer-2 | 1 | 4 | 5 | 5 |
| Customer-3 | 0 | 1 | 3 | 1 |
| Customer-N | 1 | 1 | 4 | 4 |
| ... | ... | ... | ... | ... |
| Q1(整體滿意度) | Q2 | Q3 | Q4 | |
|---|---|---|---|---|
| Customer-1 | 1 | 5 | 5 | 5 |
| Customer-2 | 1 | 4 | 5 | 5 |
| Customer-3 | 0 | 1 | 3 | 1 |
| Customer-N | 1 | 1 | 4 | 4 |
| ... | ... | ... | ... | ... |
$$
| Q1(整體滿意度) | Q2 | Q3 | Q4 | |
|---|---|---|---|---|
| Customer-1 | 1 | 5 | 5 | 5 |
| Customer-2 | 1 | 4 | 5 | 5 |
| Customer-3 | 0 | 1 | 3 | 1 |
| Customer-N | 1 | 1 | 4 | 4 |
| ... | ... | ... | ... | ... |
$$
Logistic regression model
$f(\text{overall satisfaction}) = \beta_1 * Q2 + \beta_2 * Q3 + \beta_3 * Q4$
Logistic regression model
$f(\text{overall satisfaction}) = \beta_1 * Q2 + \beta_2 * Q3 + \beta_3 * Q4$
模型輸出
$f(\text{overall satisfaction}) = 0.25 * Q2 + 0.25 * Q3 + 1 * Q4$
Beta 總和
| Beta | Beta 總和 | 佔比 | |
|---|---|---|---|
| Q2 | .25 | 0.6 | .42 |
| Q3 | .25 | 0.6 | .42 |
| Q4 | .1 | 0.6 | .16 |
$$
| Beta | Beta 總和 | 佔比 | |
|---|---|---|---|
| Q2 | .25 | 0.6 | .42 |
| Q3 | .25 | 0.6 | .42 |
| Q4 | .1 | 0.6 | .16 |
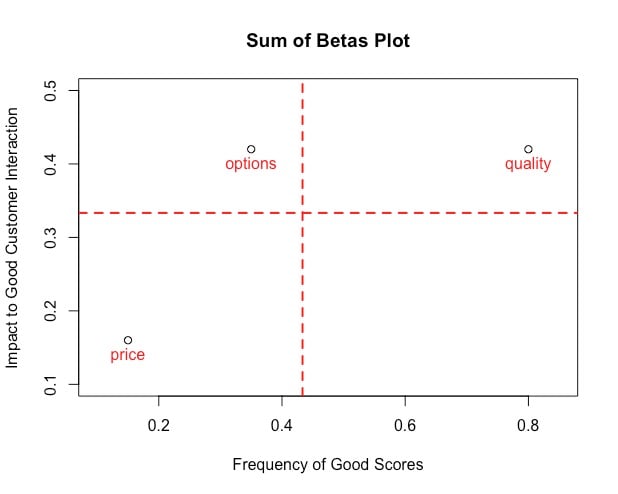
加入組織在各面向表現良好的頻率作為脈絡
| Beta | Beta 總和 | 佔比 | 高分的出現頻率 | |
|---|---|---|---|---|
| Q2 | .25 | 0.6 | .42 | .8 |
| Q3 | .25 | 0.6 | .42 | .35 |
| Q4 | .1 | 0.6 | .16 | .15 |

以資料驅動的商業決策