Python 投資組合分析入門
Charlotte Werger
Data Scientist
$$
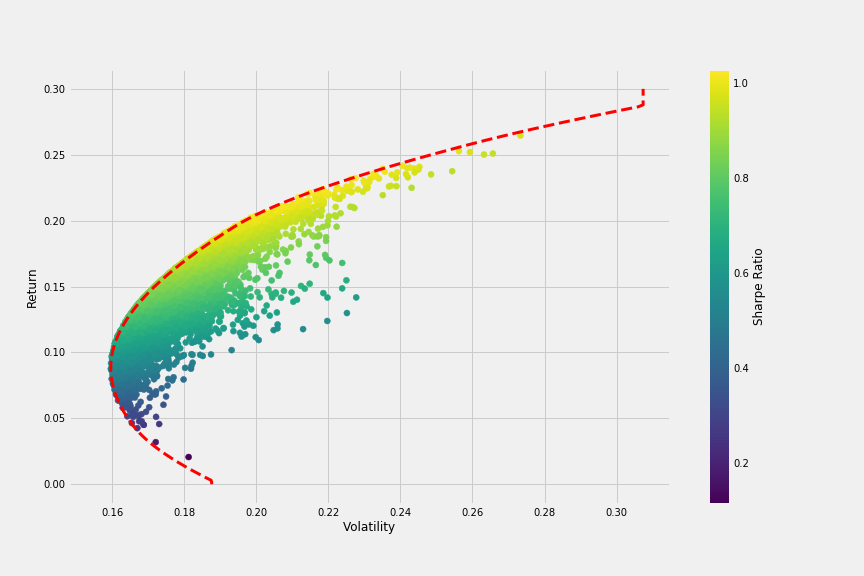
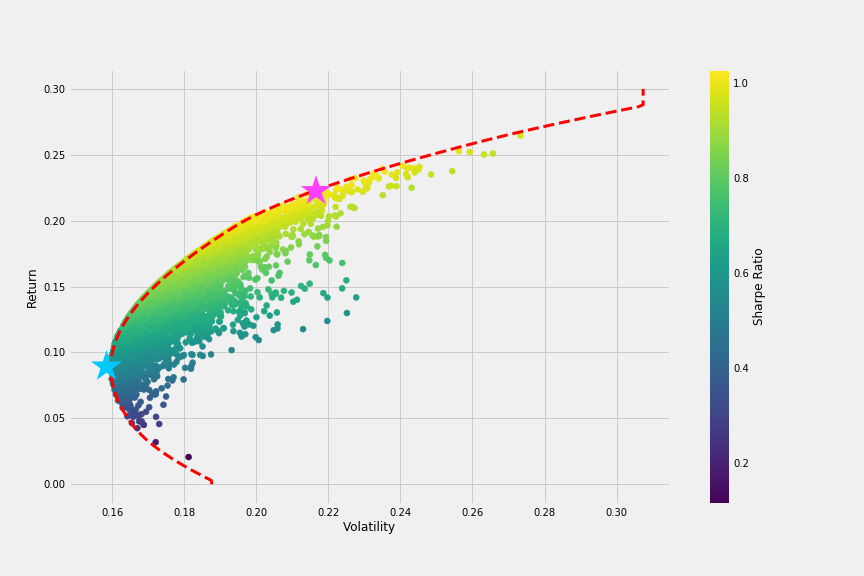
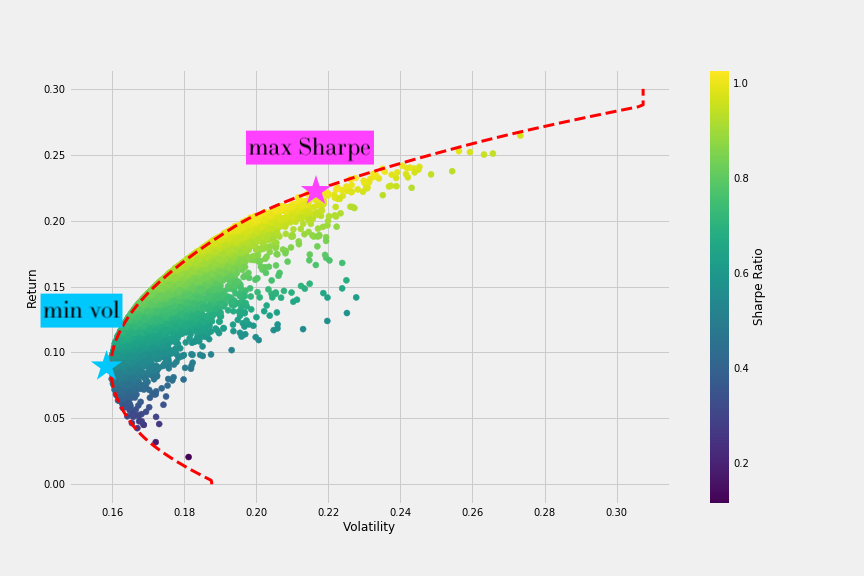
最大夏普組合:有效邊界上的「最高夏普比率」
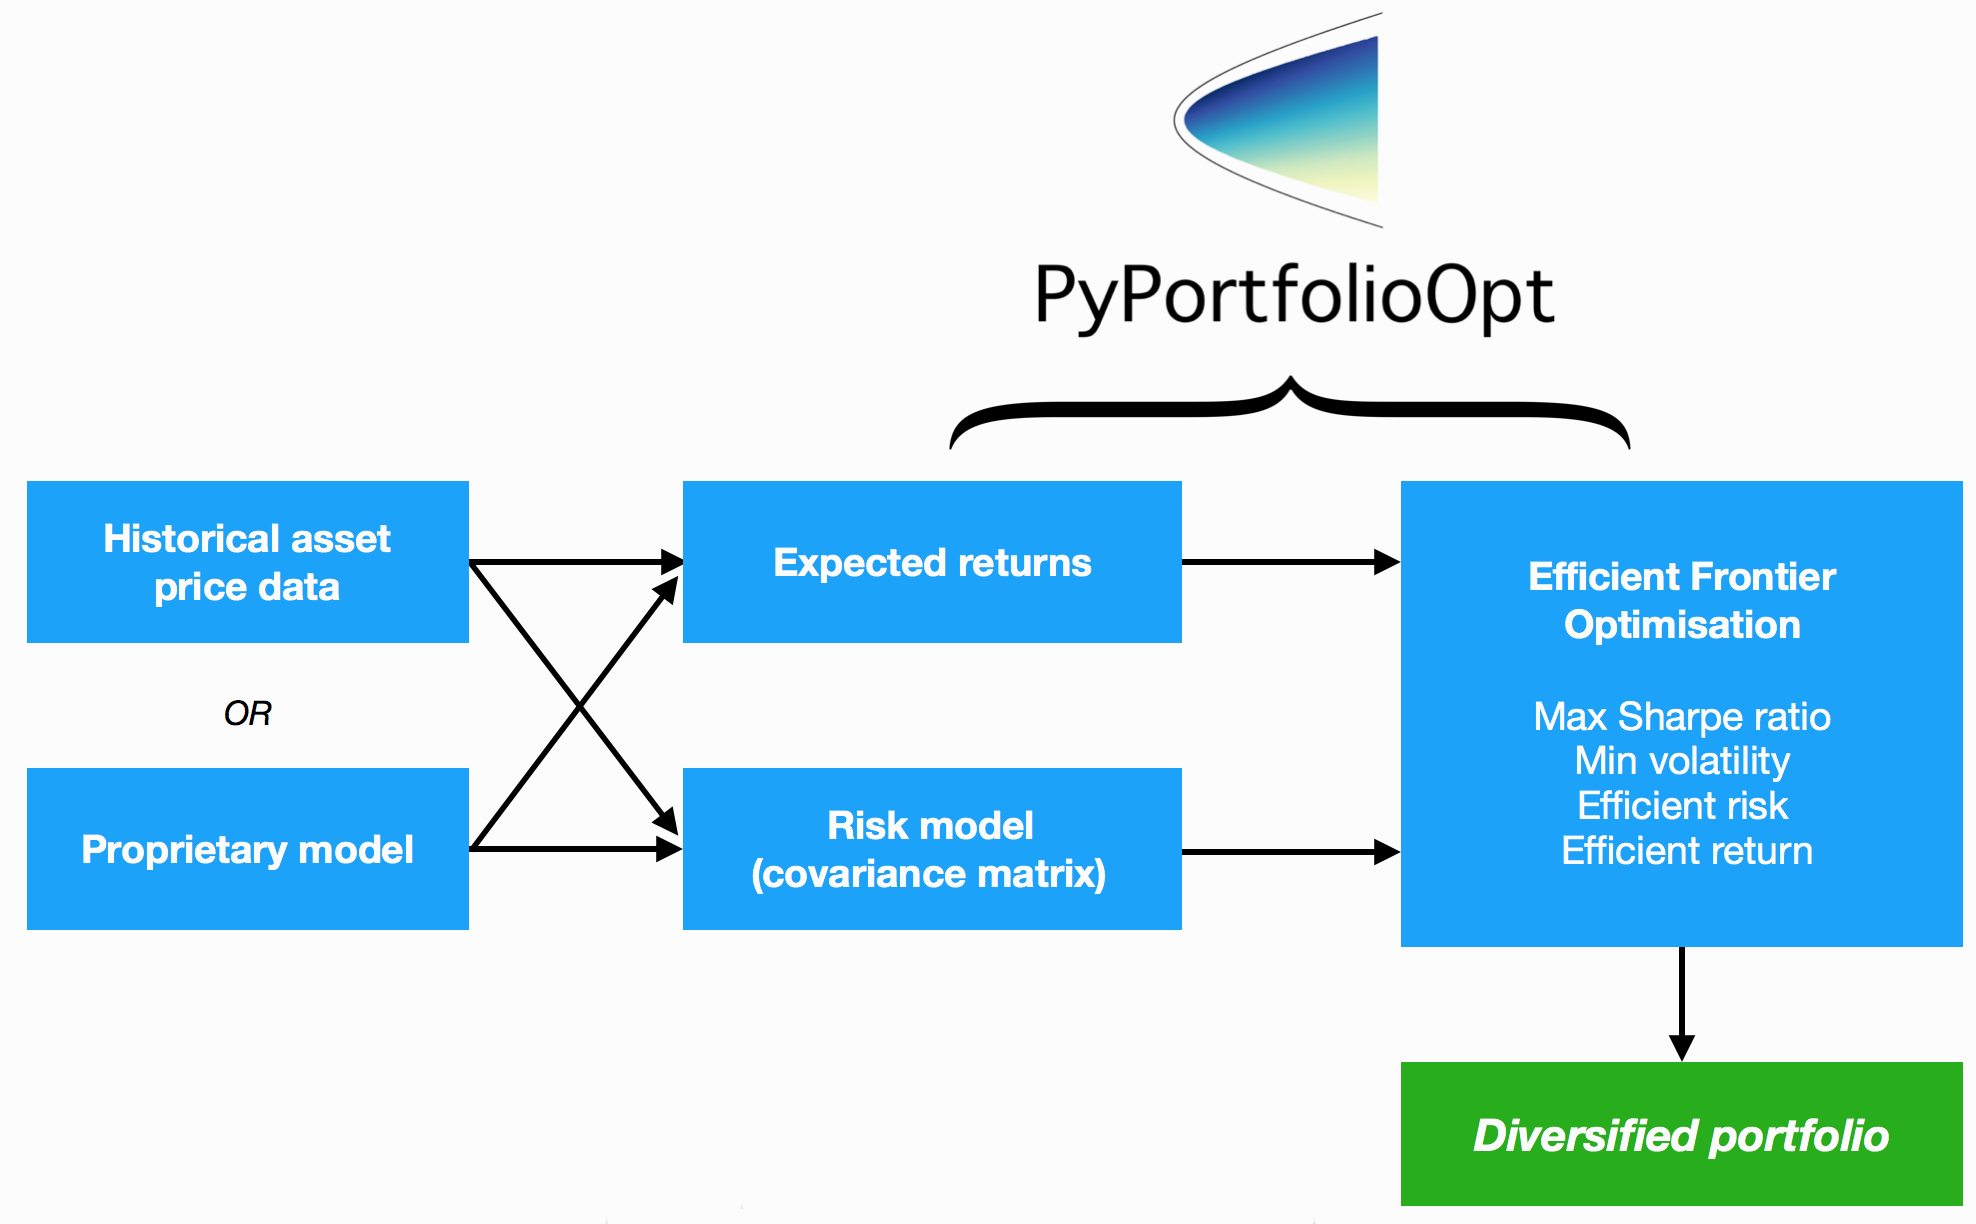
from pypfopt.efficient_frontier import EfficientFrontier
# Calculate the Efficient Frontier with mu and S
ef = EfficientFrontier(mu, Sigma)
raw_weights = ef.max_sharpe()
# Get interpretable weights
cleaned_weights = ef.clean_weights()
{'GOOG': 0.01269,'AAPL': 0.09202,'FB': 0.19856,
 'BABA': 0.09642,'AMZN': 0.07158,'GE': 0.02456,...}
# Get performance numbers
ef.portfolio_performance(verbose=True)
預期年化報酬:33.0%
年化波動:21.7%
夏普比率:1.43
最小波動組合:有效邊界上的「風險最低」
# Calculate the Efficient Frontier with mu and S
ef = EfficientFrontier(mu, Sigma)
raw_weights = ef.min_volatility()
# Get interpretable weights and performance numbers
cleaned_weights = ef.clean_weights()
{'GOOG': 0.05664, 'AAPL': 0.087, 'FB': 0.1591,
'BABA': 0.09784, 'AMZN': 0.06986, 'GE': 0.0123,...}
ef.portfolio_performance(verbose=True)
預期年化報酬:17.4%
年化波動:13.2%
夏普比率:1.28