# Define risk free rate and target return of 0
rfr = 0
target_return = 0
# Calcualte the daily returns from price data
apple_returns=pd.DataFrame(apple_price.pct_change())
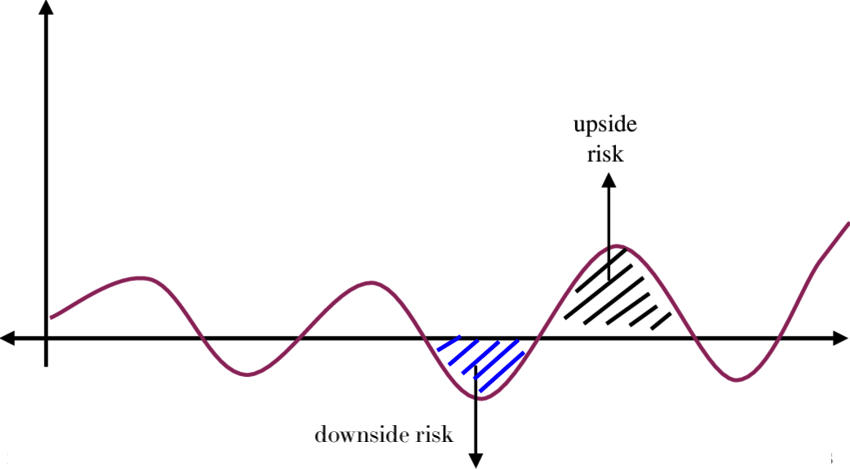
# Select the negative returns only
negative_returns = apple_returns.loc[apple_returns['AAPL'] < target]
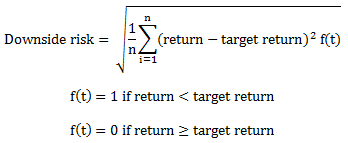
# Calculate expected return and std dev of downside returns
expected_return = apple_returns['AAPL'].mean()
down_stdev = negative_returns.std()
# Calculate the sortino ratio
sortino_ratio = (expected_return - rfr)/down_stdev
print(sortino_ratio)
0.07887683763760528
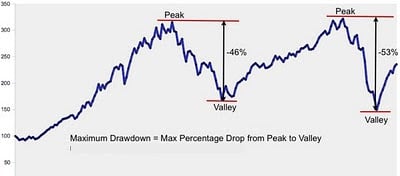
最大回檔(Drawdown)
從市場高點到低點的最大百分比跌幅
取決於所選時間窗格
復原時間:回到損益兩平所需時間
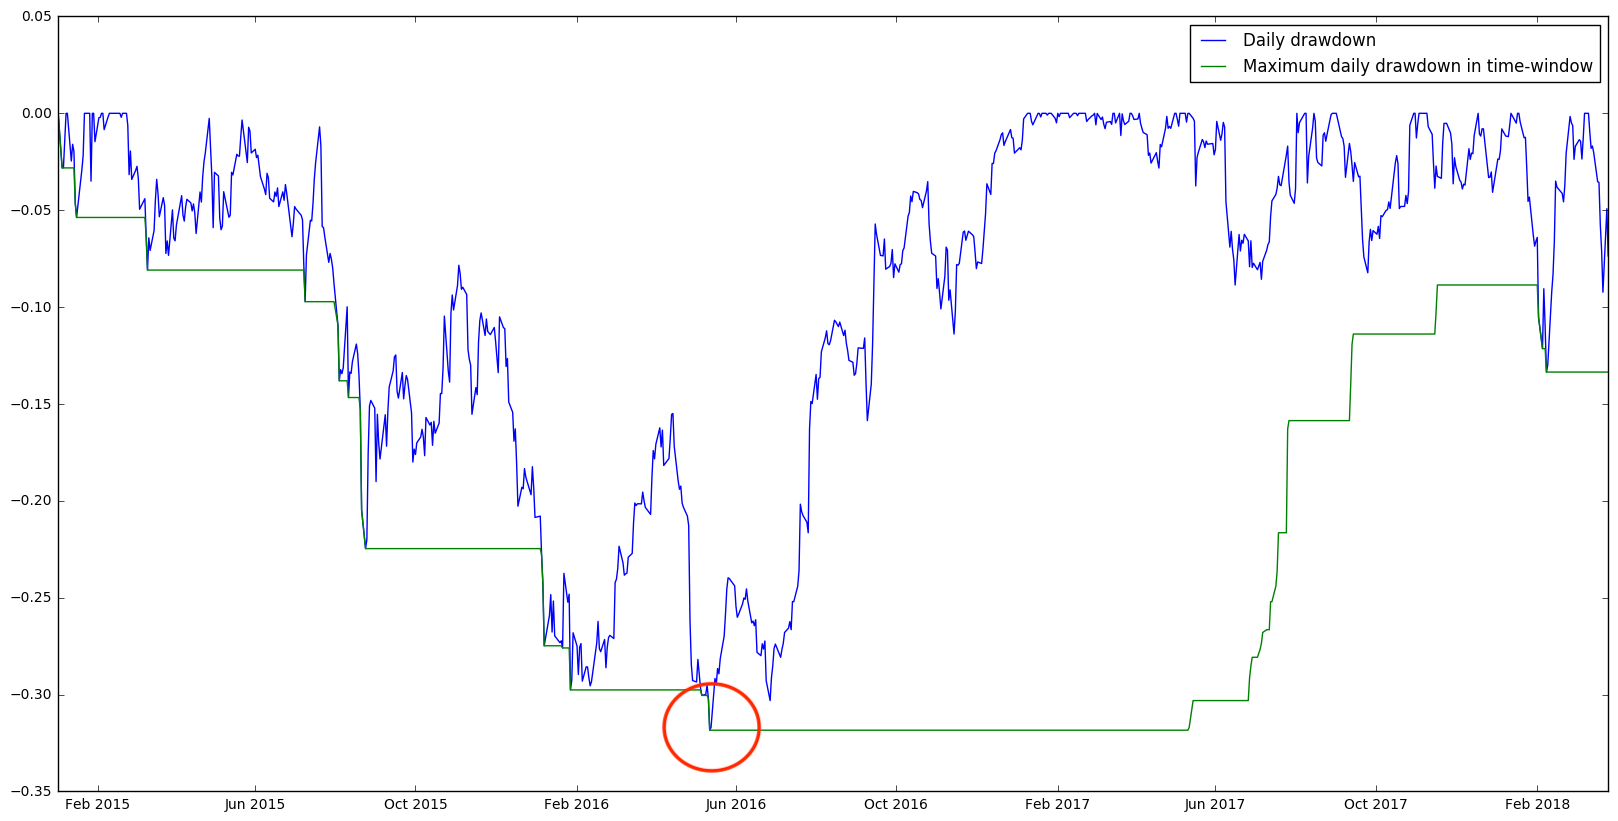
用 Python 計算每日最大回檔
# Calculate the maximum value of returns using rolling().max()
roll_max = apple_price.rolling(min_periods=1,window=250).max()

# Calculate daily draw-down from rolling max
daily_drawdown = apple_price/roll_max - 1.0

# Calculate maximum daily draw-down
max_daily_drawdown = daily_drawdown.rolling(min_periods=1,window=250).min()

# Plot the results
daily_drawdown.plot()
max_daily_drawdown.plot()
plt.show()