在 Tidyverse 中以資料溝通
Timo Grossenbacher
Data Journalist
ilo_data <- ilo_data %>%
  filter(year == "1996" | year == "2006")
ilo_plot <- ggplot(ilo_data) +
  geom_histogram(aes(
    x = working_hours)) +
  labs(x = "Working hours per week",
       y = "Number of countries")
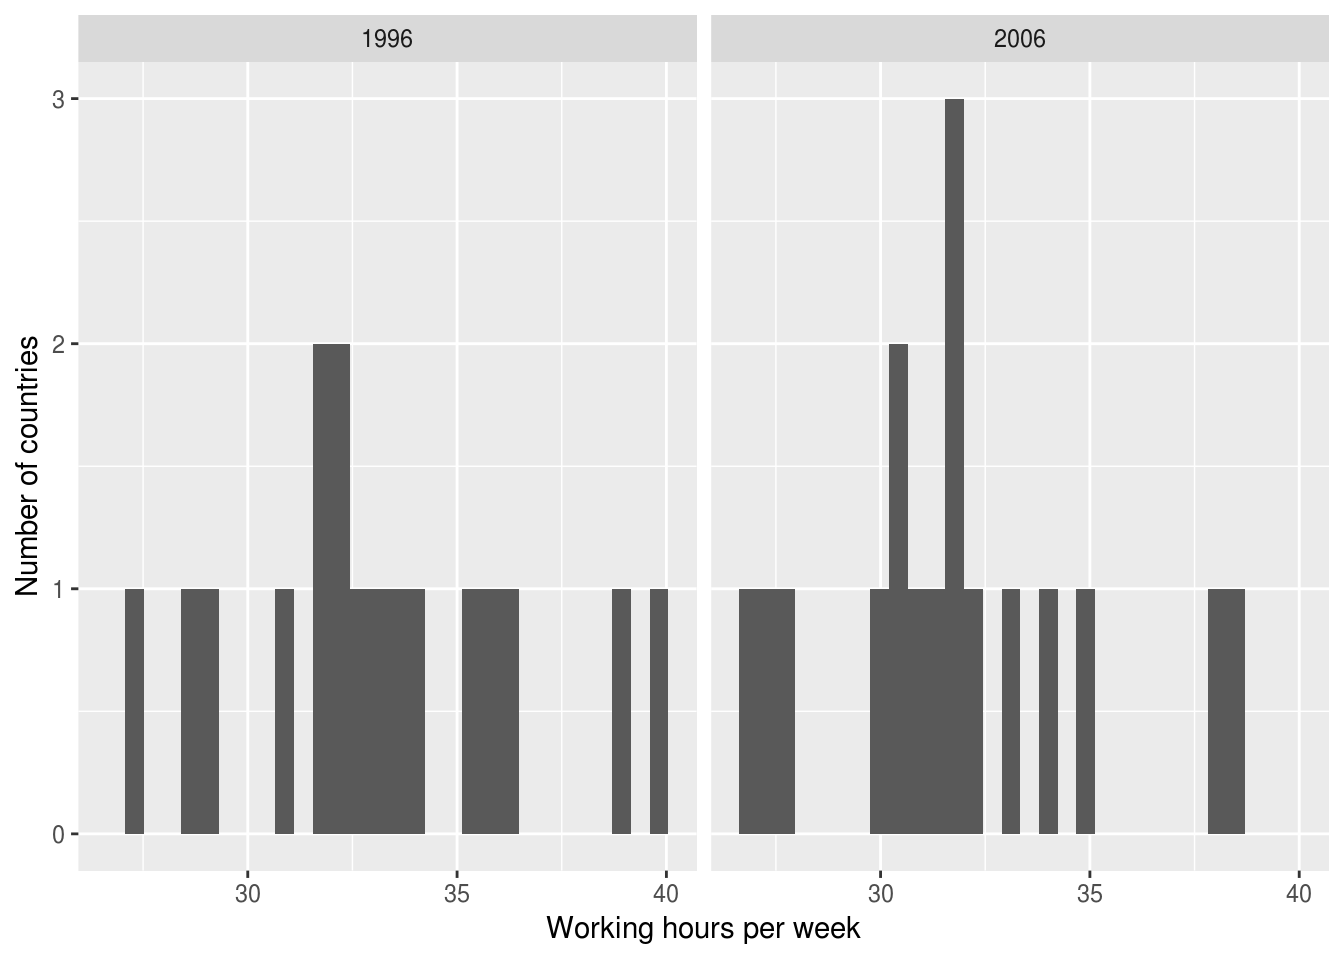
ilo_plot +
  facet_grid(cols = vars(year))
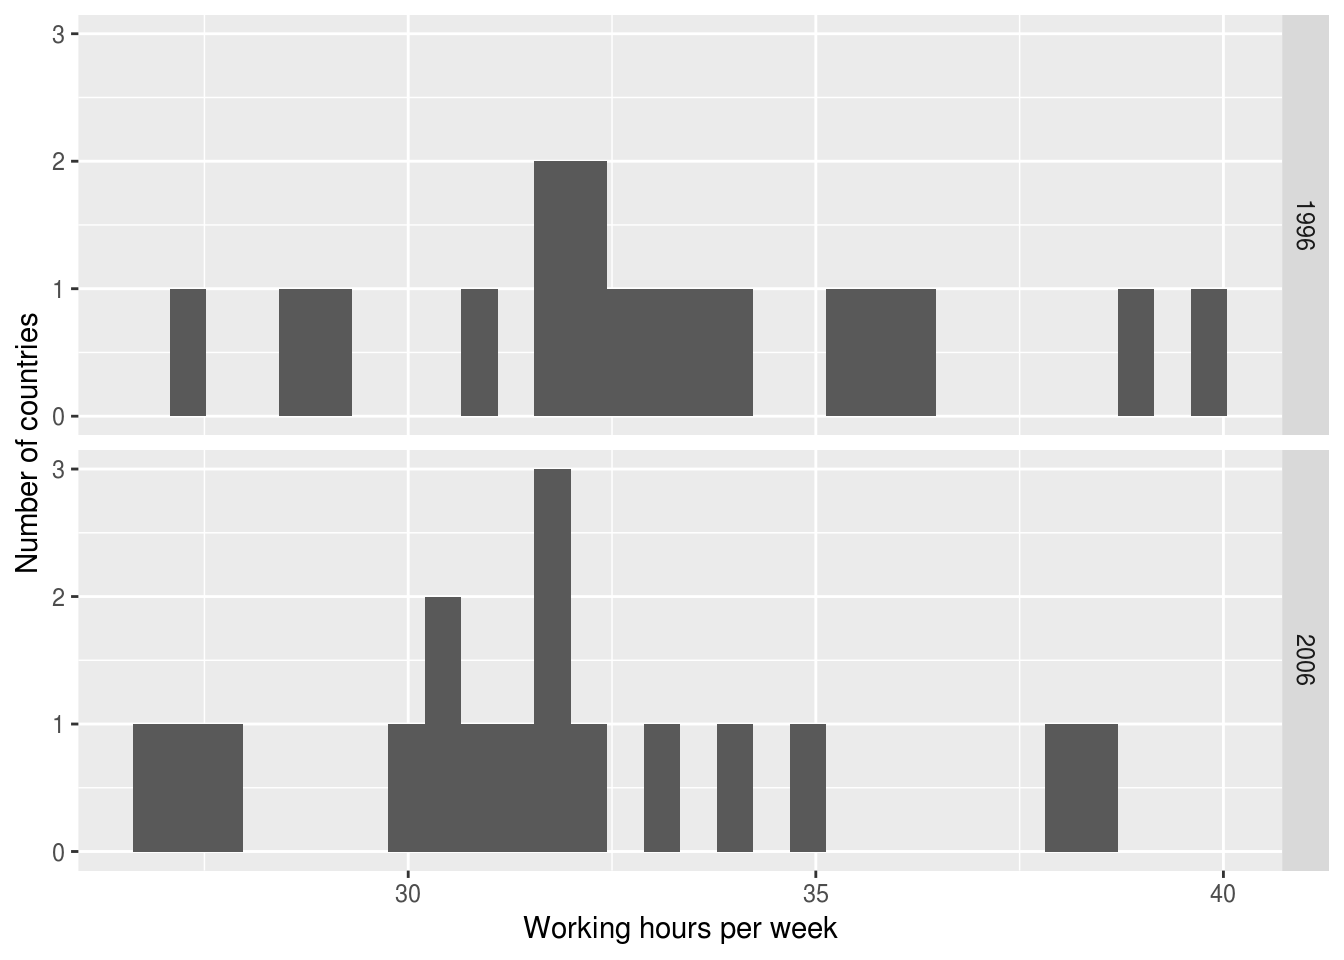
ilo_plot +
  facet_grid(rows = vars(year))
ilo_data <- ilo_data %>%
  filter(year == "1996" | year == "2006")
ggplot(ilo_data) +
  geom_histogram(aes(x = working_hours)) +
  labs(x = "Working hours per week",
       y = "Number of countries") +
  facet_grid(cols = vars(year))
ggplot(ilo_data) +
  geom_histogram(aes(x = working_hours)) +
  labs(x = "Working hours per week",
       y = "Number of countries") +
  facet_wrap(facets = vars(year))
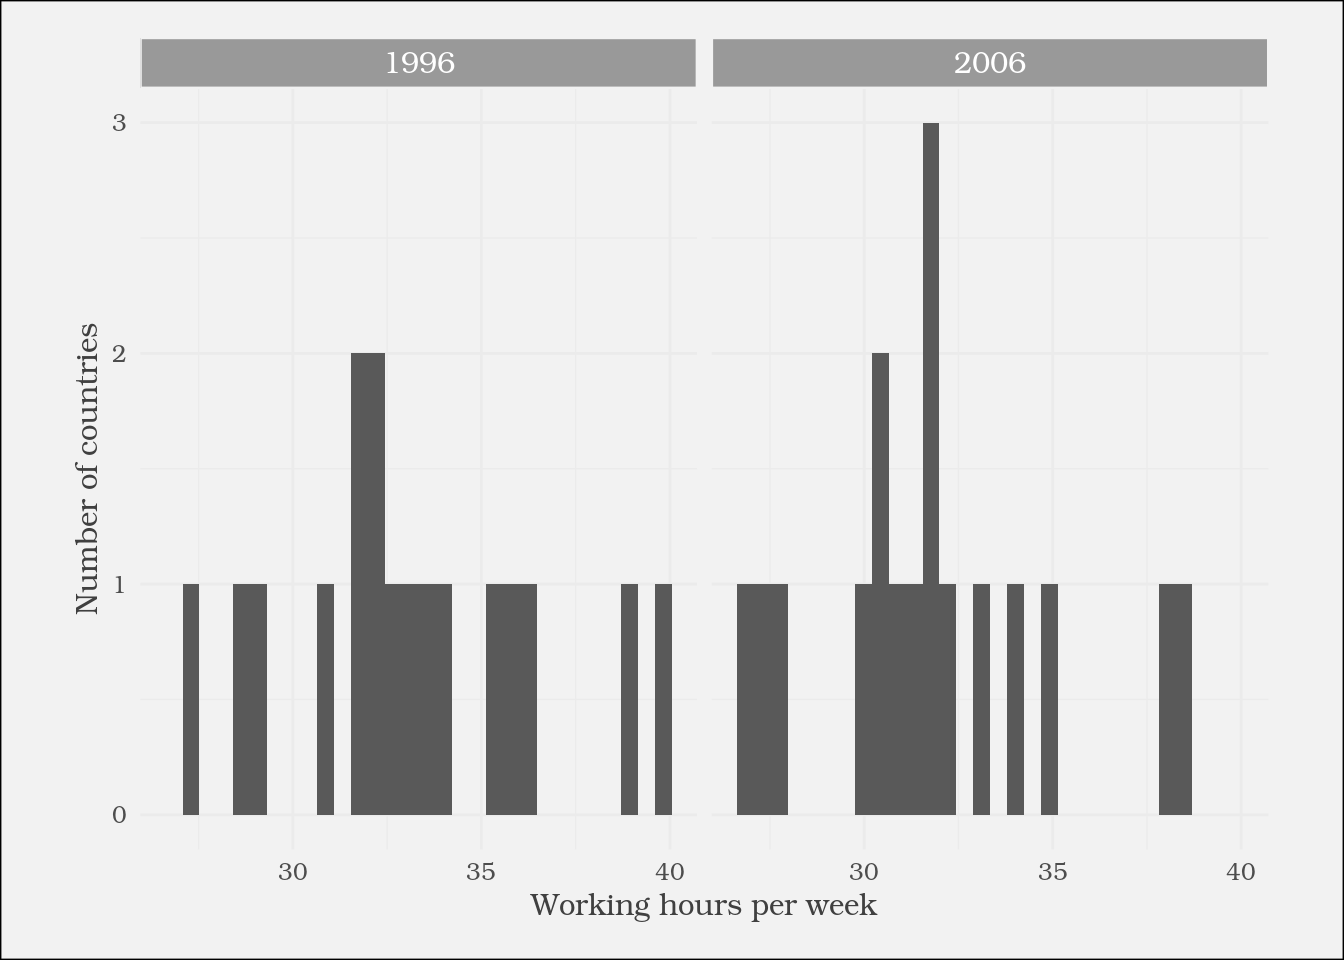
strip.background
strip.text
...
theme_green <- function(){
  theme(
    plot.background =
      element_rect(fill = "green"),
    panel.background =
      element_rect(fill =
        "lightgreen")
  )}
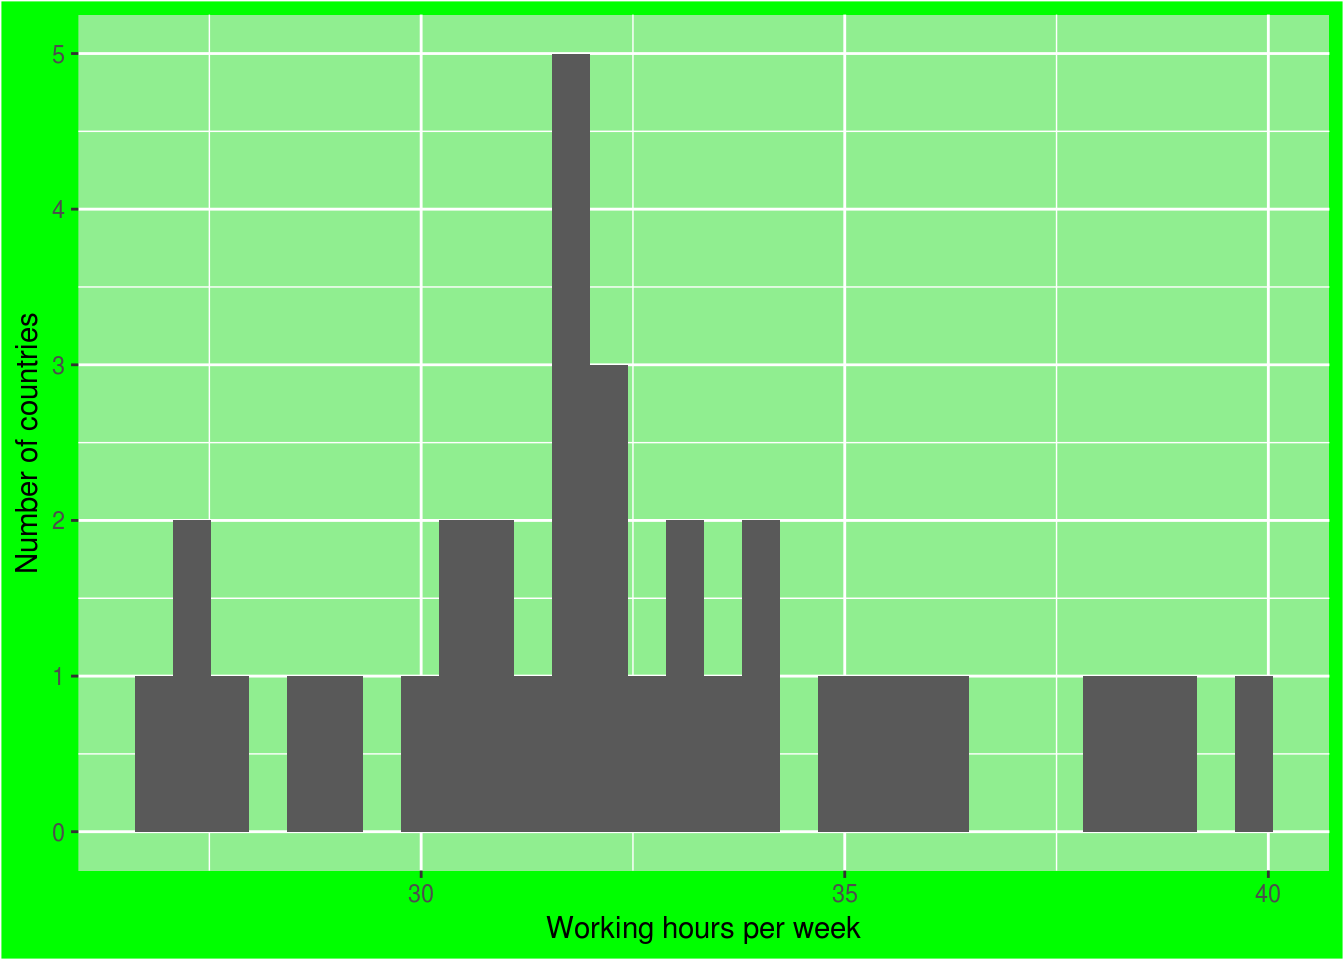
ggplot(ilo_data) +
  geom_histogram(aes(
    x = working_hours)) +
  labs(x = "Working hours per week",
       y = "Number of countries") +

theme_green()
ggplot(ilo_data) + geom_histogram(aes( x = working_hours)) + labs(x = "Working hours per week", y = "Number of countries") +
theme_green()