檢定力分析:樣本與效應量

Python 的實驗設計

James Chapman

Curriculum Manager, DataCamp

效應量入門
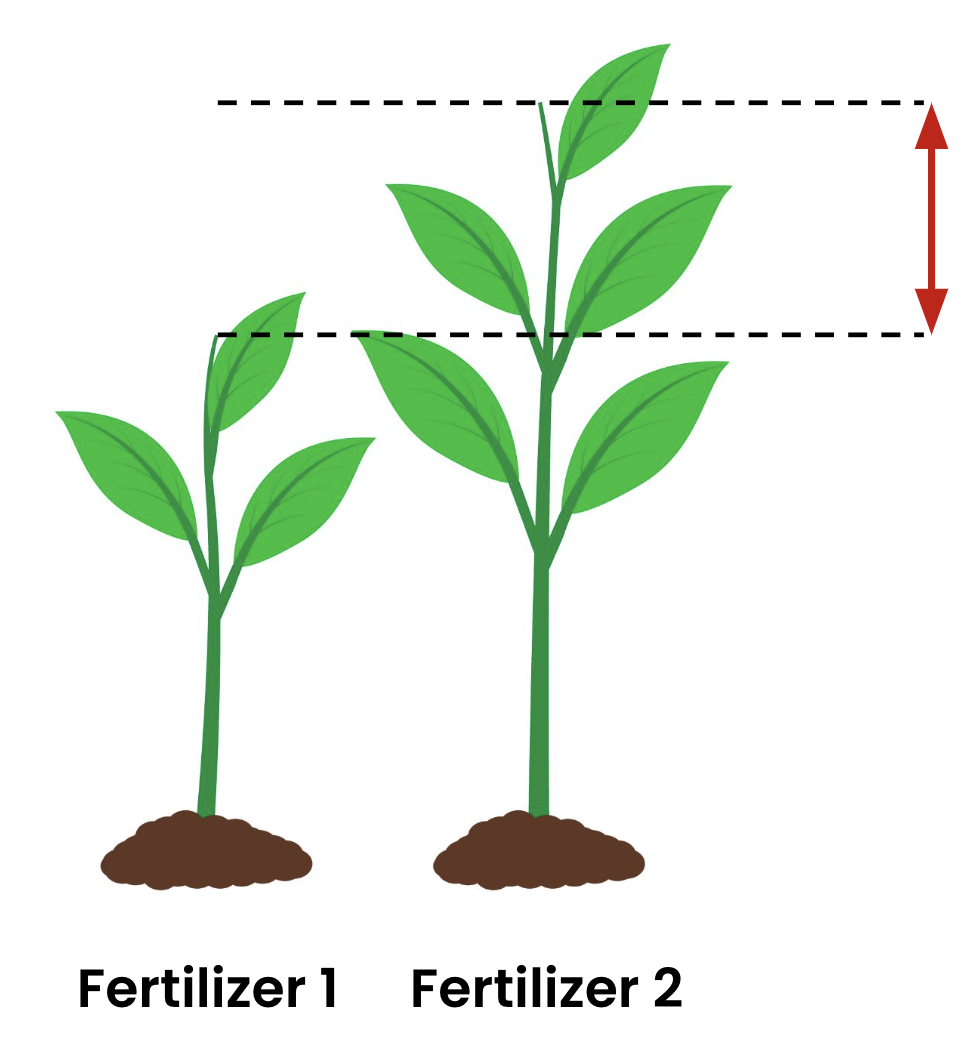
 

  • 效應量(effect size):量化兩組之間的差異


  • Cohen's d:效應量的標準指標

兩株施用不同肥料的植物,長到不同高度。以箭頭標示高度差,代表效應量。

Python 的實驗設計

資料集:電玩遊戲投入時間

  • 60 位參與者
    • 隨機分配 30 位到 Action
    • 隨機分配 30 位到 Puzzle
video_game_data.head()
   Game_Genre  Engagement_Time
0      Action              5.1
1      Puzzle              4.4
2      Action              7.2
3      Action              5.3
4      Puzzle              2.7
Python 的實驗設計

檢定力計算概覽

  • 檢定力(power):正確拒絕錯誤虛無假設的機率($1 - \beta$)

    • 介於 01(可偵測真實效應的把握度)
  • 假設 effect_size=1 來自歷史資料

from statsmodels.stats.power import TTestIndPower
power_analysis = TTestIndPower()

power = power_analysis.solve_power(effect_size=1, nobs1=30, alpha=0.05) print(power)
0.9677082519951168
Python 的實驗設計

Cohen's d 的推導

def cohens_d(group1, group2):

diff = group1.mean() - group2.mean() n1, n2 = len(group1), len(group2) var1, var2 = group1.var(), group2.var()
pooled_std = np.sqrt(((n1 - 1) * var1 + (n2 - 1) * var2) / (n1 + n2 - 2))
d = diff / pooled_std return d

合併標準差(Pooled Standard Deviation):$\sigma_{p} = \sqrt{\frac{(n_1 - 1) \times \text{var}_1 + (n_2 - 1) \times \text{var}_2}{n_1 + n_2 - 2}}$

Python 的實驗設計

電玩資料的 Cohen's d

action_times = video_game_data[video_game_data['Game_Genre'] == 'Action']['Engagement_Time']
puzzle_times = video_game_data[video_game_data['Game_Genre'] == 'Puzzle']['Engagement_Time']

d = cohens_d(action_times, puzzle_times) print(f"Cohen's d: {d}")
Cohen's d: 1.161524633221452
Python 的實驗設計

理解樣本數與檢定力

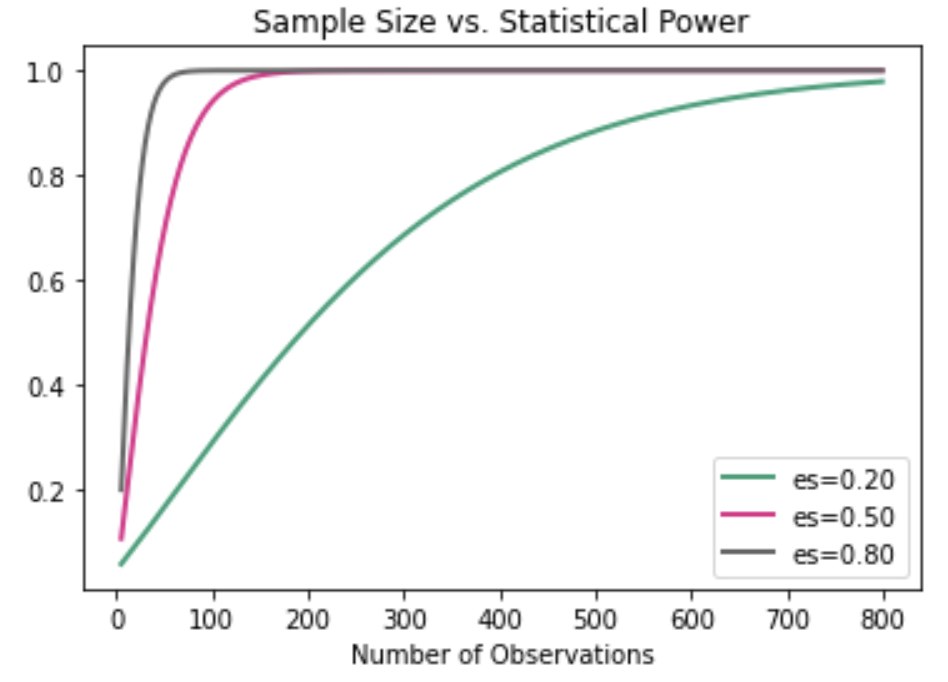
  • 在檢定力與樣本數間的取捨
  • 樣本數越大,研究檢定力越高

樣本數 vs. 檢定力.png

1 https://grabngoinfo.com/power-analysis-for-sample-size-using-python/
Python 的實驗設計

情境化的樣本數計算

  • 反應變數:engagement_time
from statsmodels.stats.power import TTestIndPower
power_analysis = TTestIndPower()
required_n = power_analysis.solve_power(effect_size=d, alpha=0.05, 
                                        power=0.99, ratio=1)
print(required_n)
28.237827708942007
Python 的實驗設計

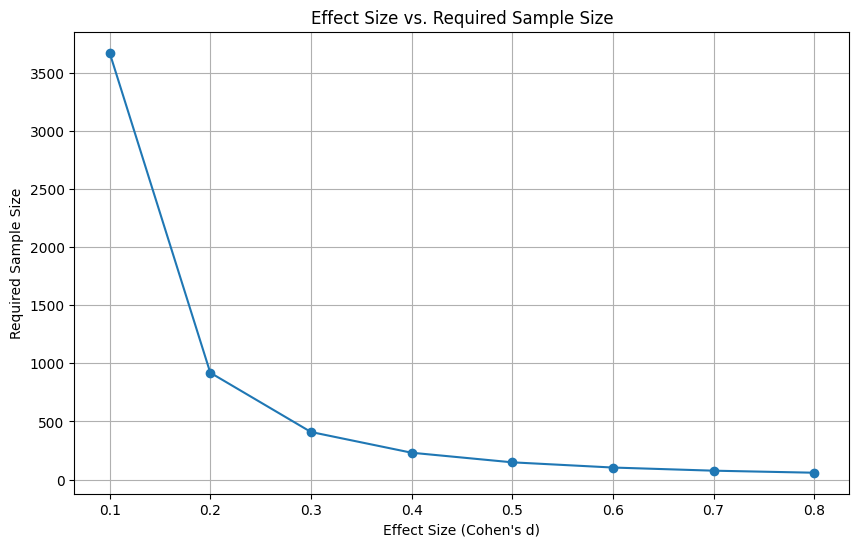
視覺化所需樣本數

import numpy as np
import matplotlib.pyplot as plt
effect_sizes = np.linspace(0.1, 0.8, 8)
sample_sizes = [power_analysis.solve_power(effect_size=es, alpha=0.05, power=0.99, 
                                           ratio=1) for es in effect_sizes]

plt.figure(figsize=(10, 6))
plt.plot(effect_sizes, sample_sizes, 'o-')
plt.title('Effect Size vs. Required Sample Size')
plt.xlabel('Effect Size (Cohen\'s d)')
plt.ylabel('Required Sample Size')
plt.grid(True)
plt.show()
Python 的實驗設計

視覺化所需樣本數

效應量 vs. 所需樣本數.png

Python 的實驗設計

一起來練習吧!

Python 的實驗設計

Preparing Video For Download...