Python 的實驗設計
James Chapman
Curriculum Manager, DataCamp
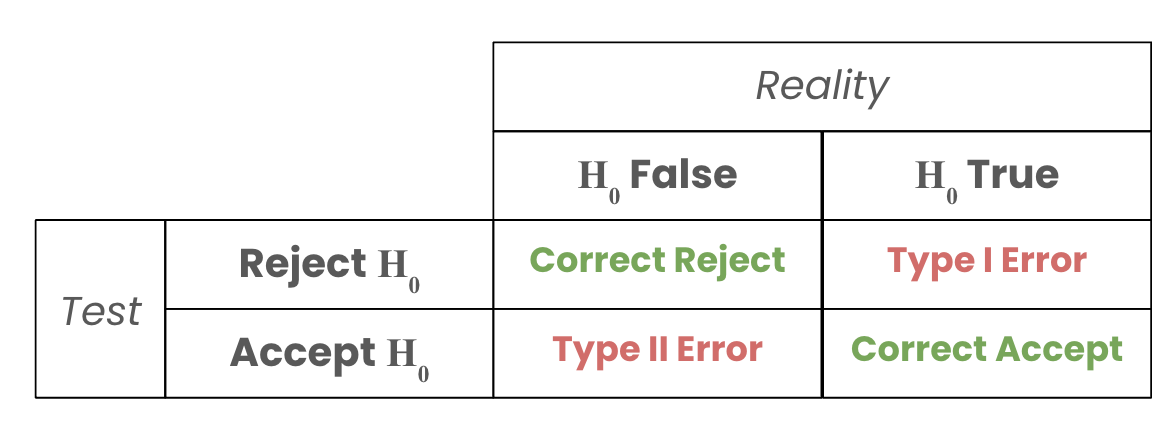
P 值:在虛無假設為真時觀察到資料的機率
$\alpha$:判定結果「具統計顯著」的門檻
P 值 $\le \alpha$:拒絕虛無假設,採用對立假設

crop_yields.head()
Fertilizer_Type Crop_Yield
0 Organic 26.225
1 Synthetic 17.452
2 Organic 22.283
3 Synthetic 23.548
4 Synthetic 24.138
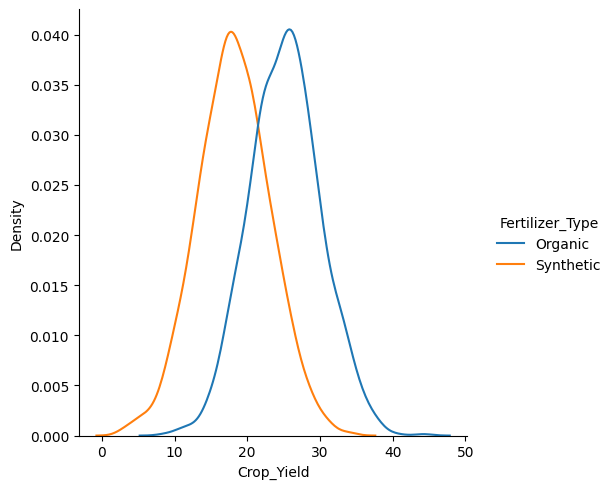
import seaborn as sns
sns.displot(data=crop_data, x="Crop_Yield", hue="Fertilizer_Type", kind="kde")
$\alpha = 0.05$
from scipy.stats import ttest_ind
organic_yield = crop_yields[crop_yields['Fertilizer_Type'] == 'Organic']
['Crop_Yield']
synthetic_yield = crop_yields[crop_yields['Fertilizer_Type'] == 'Synthetic']
['Crop_Yield']
t_stat, p_val = ttest_ind(organic_yield, synthetic_yield)
print(p_val)
1.8496748715743899e-209

Python 的實驗設計