如何在 pandas 使用日期與時間
Manipulating Time Series Data in Python

Stefan Jansen
Founder & Lead Data Scientist at Applied Artificial Intelligence
日期與時間序列功能
- 核心:日期與時間的資料型別
- 表示時間點與區間的物件
- 屬性與方法反映時間細節
- 日期與區間序列:
- Series 或 DataFrame 欄
- 索引:將物件轉為時間序列
- 許多 Series/DataFrame 方法仰賴索引中的時間資訊提供時間序列功能
基本元件:pd.Timestamp
import pandas as pd # assumed imported going forward from datetime import datetime # To manually create datestime_stamp = pd.Timestamp(datetime(2017, 1, 1))pd.Timestamp('2017-01-01') == time_stamp
True # Understands dates as strings
time_stamp # type: pandas.tslib.Timestamp
Timestamp('2017-01-01 00:00:00')
基本元件:pd.Timestamp
- Timestamp 物件有許多屬性可儲存時間資訊
time_stamp.year
2017
time_stamp.day_name()
'Sunday'
更多元件:pd.Period 與 freq
period = pd.Period('2017-01')period # default: month-end
Period('2017-01', 'M')
period.asfreq('D') # convert to daily
Period('2017-01-31', 'D')
period.to_timestamp().to_period('M')
Period('2017-01', 'M')
- Period 物件有 freq 屬性儲存頻率資訊
- 在
pd.Period()與pd.Timestamp()之間轉換
更多元件:pd.Period 與 freq
period + 2
Period('2017-03', 'M')
pd.Timestamp('2017-01-31', 'M') + 1
Timestamp('2017-02-28 00:00:00', freq='M')
- 頻率資訊可進行基本日期運算
日期與時間的序列
pd.date_range:start、end、periods、freq
index = pd.date_range(start='2017-1-1', periods=12, freq='M')
index
DatetimeIndex(['2017-01-31', '2017-02-28', '2017-03-31', ...,
               '2017-09-30', '2017-10-31', '2017-11-30', '2017-12-31'],
              dtype='datetime64[ns]', freq='M')
pd.DateTimeIndex:帶頻率資訊的 Timestamp 序列
日期與時間的序列
index[0]
Timestamp('2017-01-31 00:00:00', freq='M')
index.to_period()
PeriodIndex(['2017-01', '2017-02', '2017-03', '2017-04', ...,
             '2017-11', '2017-12'], dtype='period[M]', freq='M')
建立時間序列:pd.DateTimeIndex
pd.DataFrame({'data': index}).info()
RangeIndex: 12 entries, 0 to 11
Data columns (total 1 columns):
data    12 non-null datetime64[ns]
dtypes: datetime64[ns](1)
建立時間序列:pd.DateTimeIndex
np.random.random:- 隨機數:
[0,1] - 12 列、2 欄
- 隨機數:
data = np.random.random((size=12,2))pd.DataFrame(data=data, index=index).info()
DatetimeIndex: 12 entries, 2017-01-31 to 2017-12-31
Freq: M
Data columns (total 2 columns):
0    12 non-null float64
1    12 non-null float64
dtypes: float64(2)
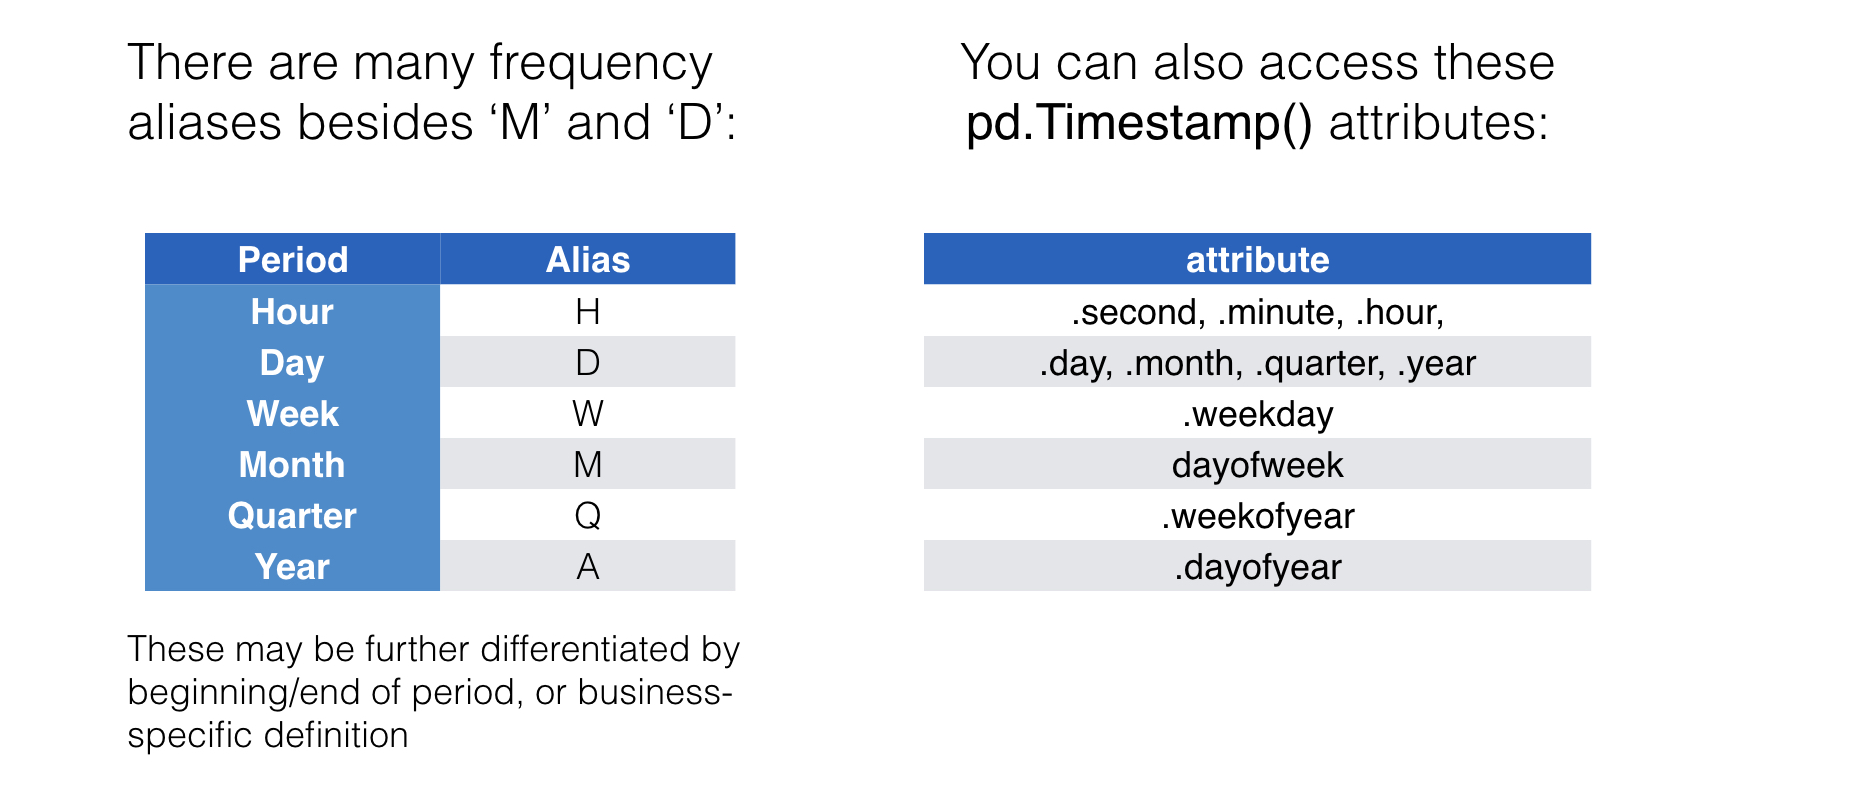
頻率別名與時間資訊
一起來練習吧!
Manipulating Time Series Data in Python

