指數相關與匯出至 Excel

Manipulating Time Series Data in Python

Stefan Jansen

Founder & Lead Data Scientist at Applied Artificial Intelligence

對你的指數做進一步分析

  • 日報酬相關性:

  • 計算所有成分股之間

  • 以熱圖視覺化

  • .xls.xlsx 格式寫入 Excel:

  • 單一工作表

  • 多個工作表

Manipulating Time Series Data in Python

指數成分—價格資料

data = DataReader(tickers, 'google', start='2016', end='2017')['Close']

data.info()
DatetimeIndex: 252 entries, 2016-01-04 to 2016-12-30
Data columns (total 12 columns):
ABB     252 non-null float64
BABA    252 non-null float64
JNJ     252 non-null float64
JPM     252 non-null float64
KO      252 non-null float64
ORCL    252 non-null float64
PG      252 non-null float64
T       252 non-null float64
TM      252 non-null float64
UPS     252 non-null float64
WMT     252 non-null float64
XOM     252 non-null float64
Manipulating Time Series Data in Python

指數成分:報酬相關性

daily_returns = data.pct_change()

correlations = daily_returns.corr()
ABB  BABA  JNJ  JPM   KO  ORCL   PG    T   TM  UPS  WMT  XOM
ABB  1.00  0.40 0.33 0.56 0.31  0.53 0.34 0.29 0.48 0.50 0.15 0.48
BABA 0.40  1.00 0.27 0.27 0.25  0.38 0.21 0.17 0.34 0.35 0.13 0.21
JNJ  0.33  0.27 1.00 0.34 0.30  0.37 0.42 0.35 0.29 0.45 0.24 0.41
JPM  0.56  0.27 0.34 1.00 0.22  0.57 0.27 0.13 0.49 0.56 0.14 0.48
KO   0.31  0.25 0.30 0.22 1.00  0.31 0.62 0.47 0.33 0.50 0.25 0.29
ORCL 0.53  0.38 0.37 0.57 0.31  1.00 0.41 0.32 0.48 0.54 0.21 0.42
PG   0.34  0.21 0.42 0.27 0.62  0.41 1.00 0.43 0.32 0.47 0.33 0.34
T    0.29  0.17 0.35 0.13 0.47  0.32 0.43 1.00 0.28 0.41 0.31 0.33
TM   0.48  0.34 0.29 0.49 0.33  0.48 0.32 0.28 1.00 0.52 0.20 0.30
UPS  0.50  0.35 0.45 0.56 0.50  0.54 0.47 0.41 0.52 1.00 0.33 0.45
WMT  0.15  0.13 0.24 0.14 0.25  0.21 0.33 0.31 0.20 0.33 1.00 0.21
XOM  0.48  0.21 0.41 0.48 0.29  0.42 0.34 0.33 0.30 0.45 0.21 1.00
Manipulating Time Series Data in Python

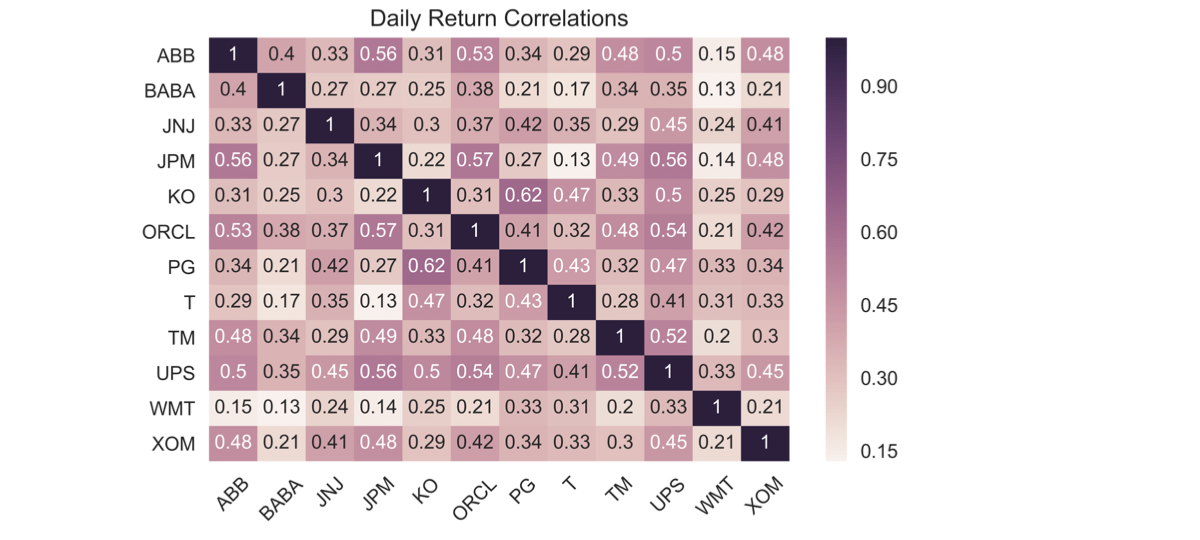
指數成分:報酬相關性

sns.heatmap(correlations, annot=True)
plt.xticks(rotation=45)
plt.title('Daily Return Correlations')
ch4_4_v2 - Index Correlation & Saving Results to Excel.010.png

Manipulating Time Series Data in Python

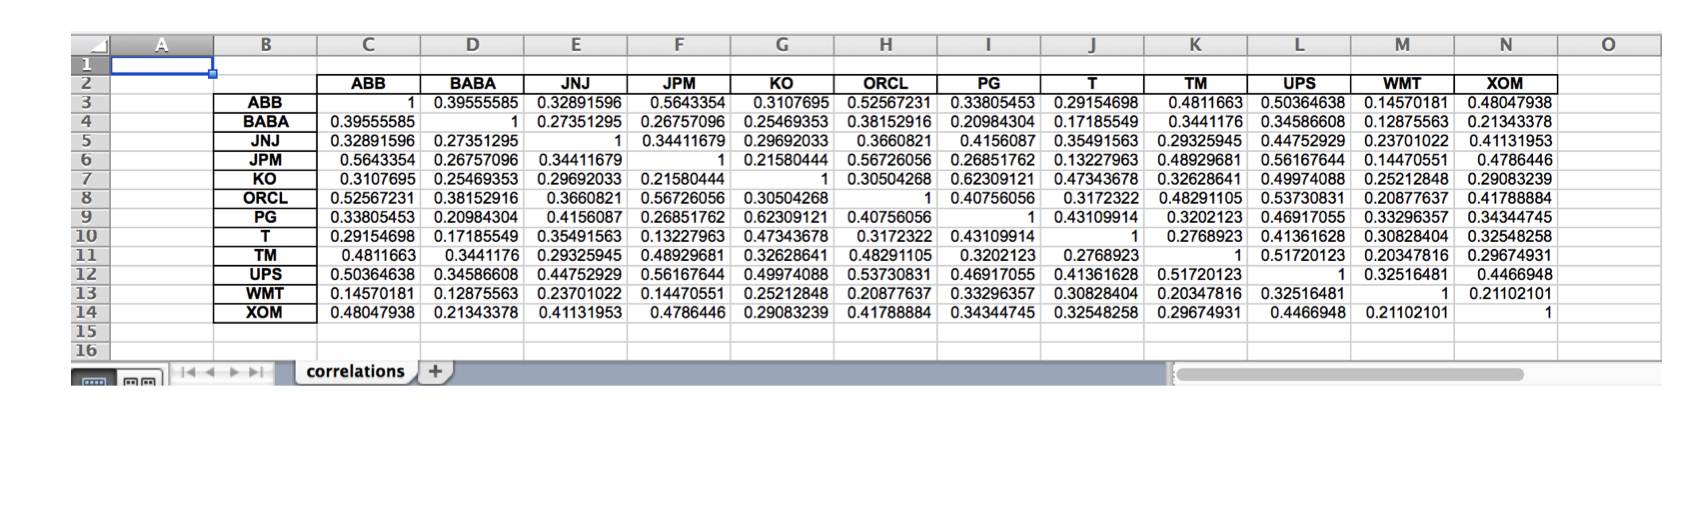
儲存到單一 Excel 工作表

correlations.to_excel(excel_writer= 'correlations.xls',
                      sheet_name='correlations',
                      startrow=1,
                      startcol=1)
ch4_4_v2 - Index Correlation & Saving Results to Excel.012.png

Manipulating Time Series Data in Python

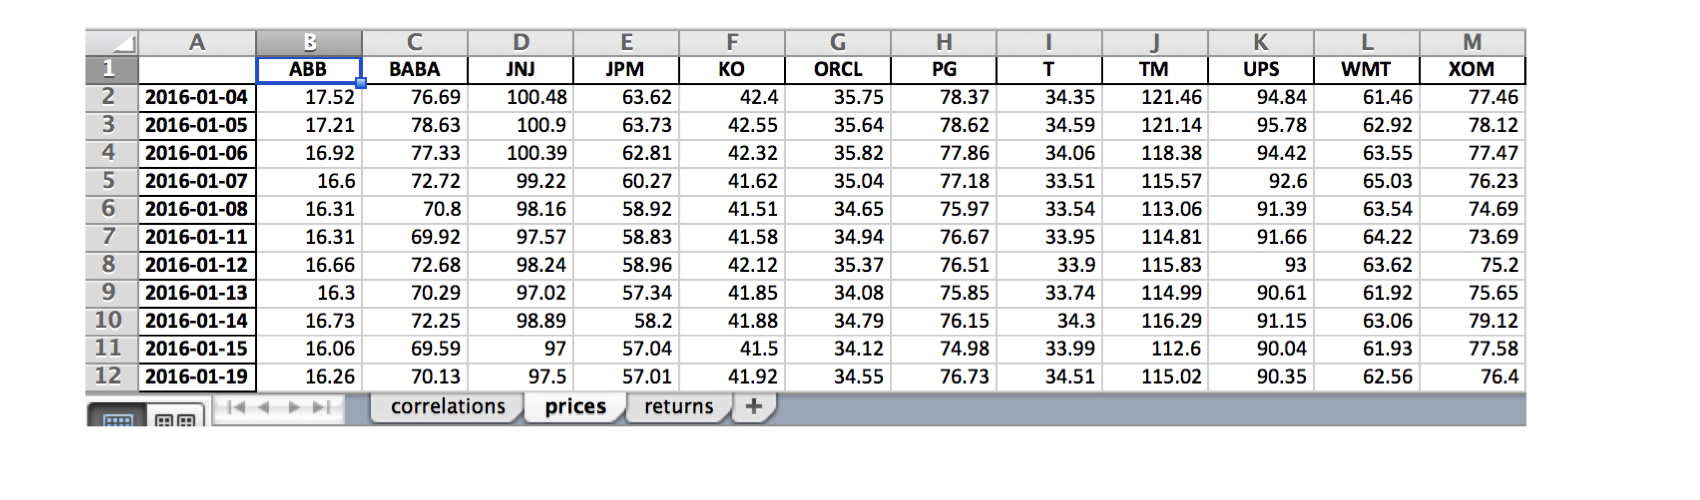
儲存到多個 Excel 工作表

data.index = data.index.date # Keep only date component

with pd.ExcelWriter('stock_data.xlsx') as writer:
corr.to_excel(excel_writer=writer, sheet_name='correlations')
data.to_excel(excel_writer=writer, sheet_name='prices')
data.pct_change().to_excel(writer, sheet_name='returns')
ch4_4_v2 - Index Correlation & Saving Results to Excel.015.png

Manipulating Time Series Data in Python

一起來練習吧!

Manipulating Time Series Data in Python

Preparing Video For Download...