Python 的 Explainable AI
Fouad Trad
Machine Learning Engineer


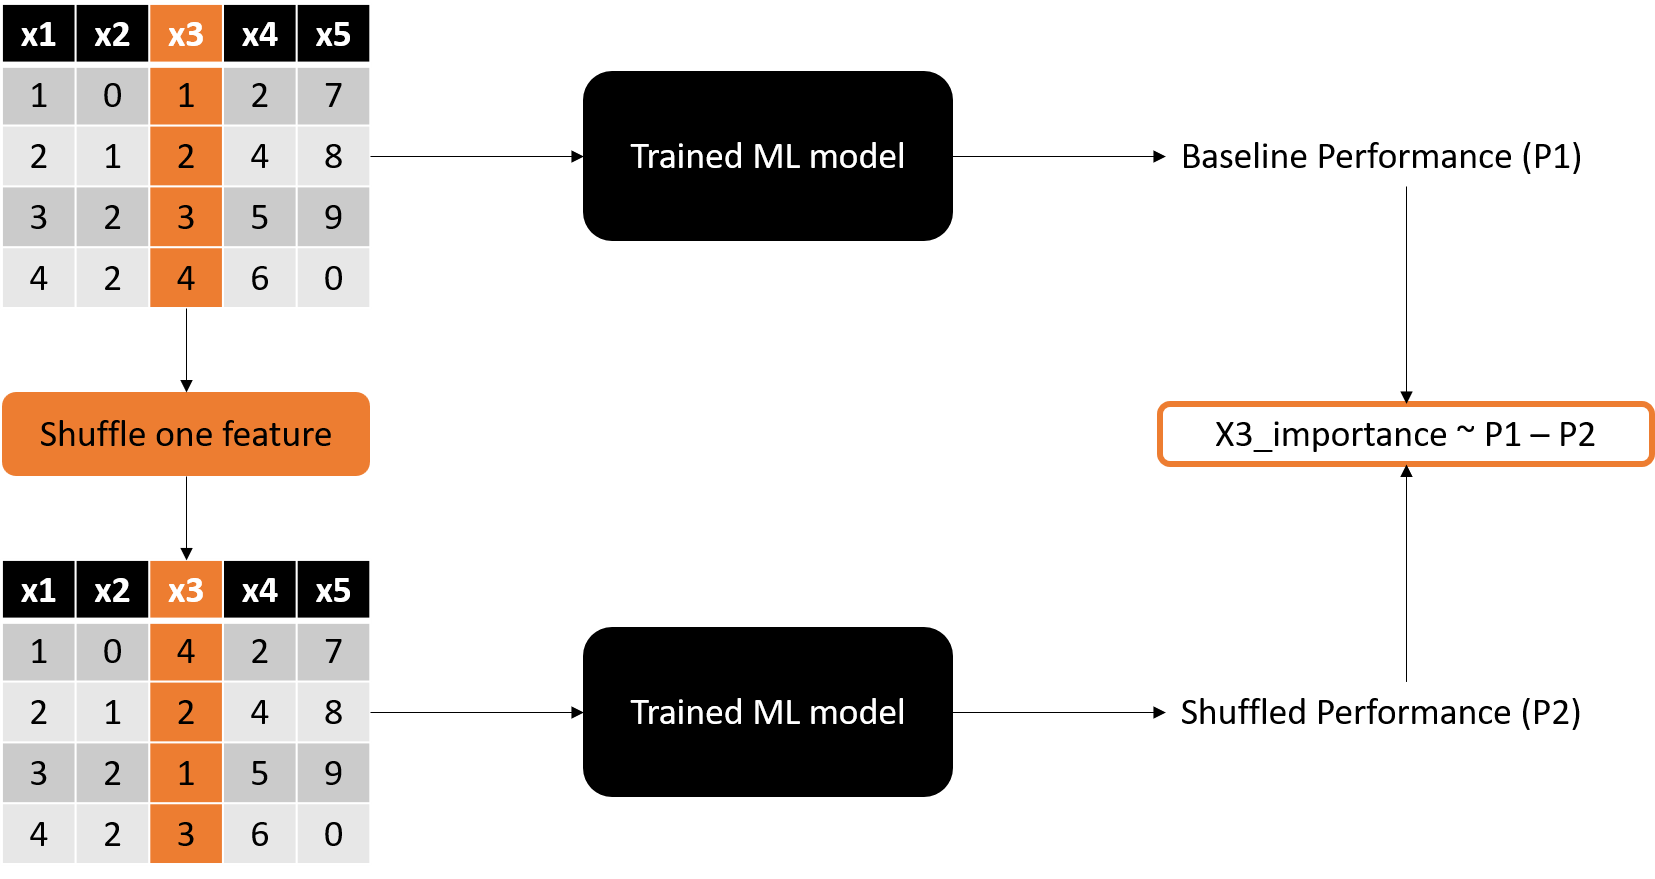
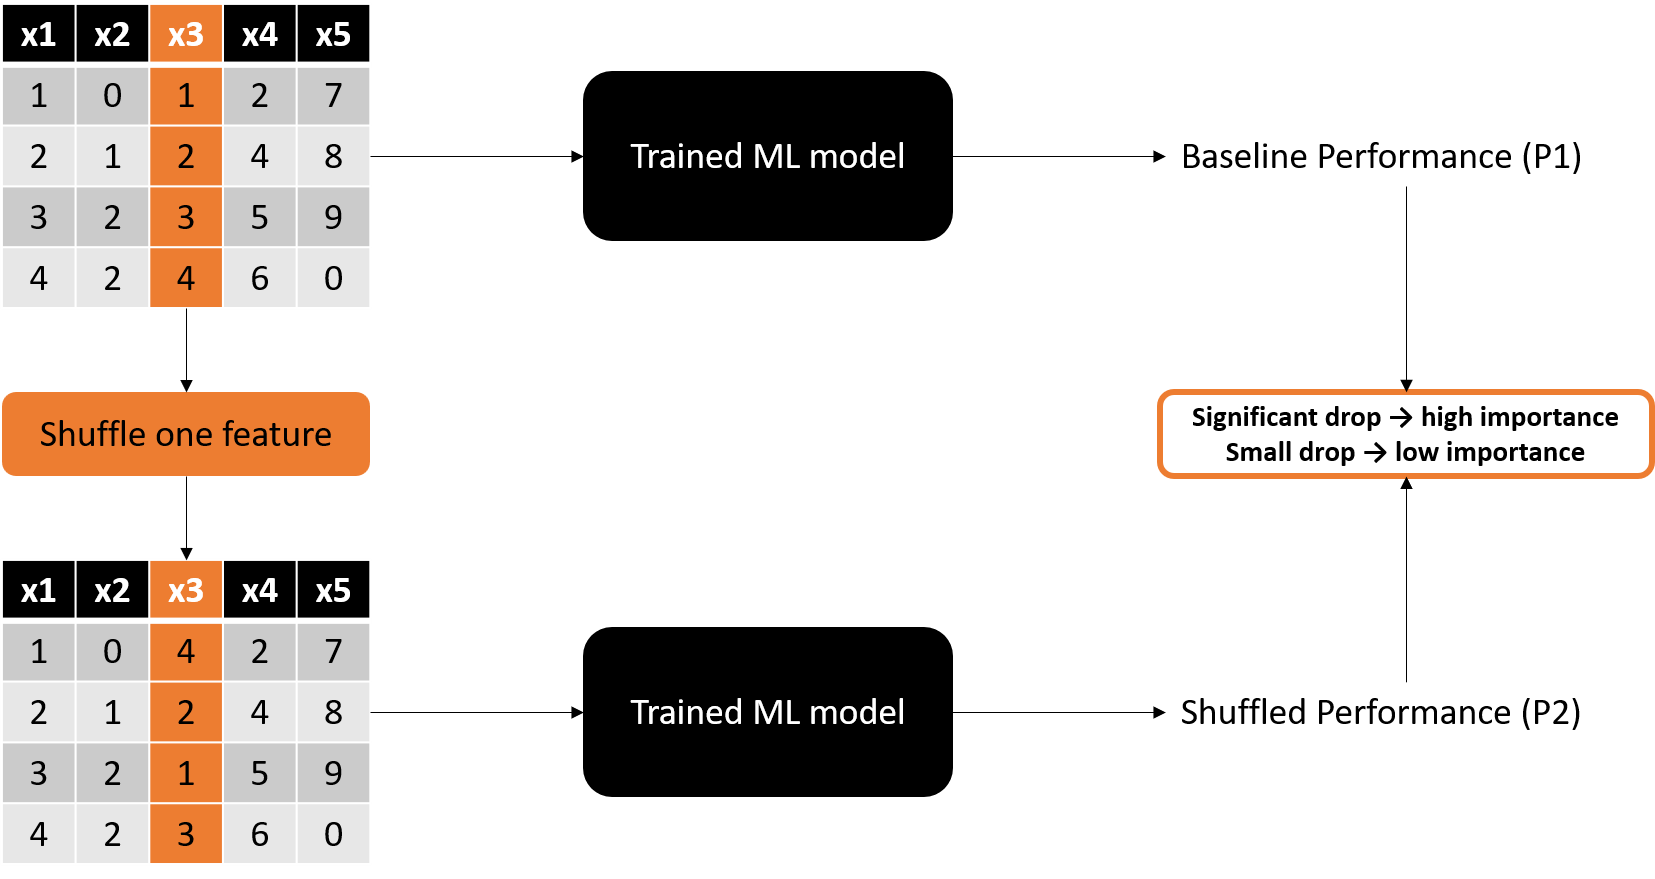
![將其中一個特徵洗牌:原值為 [1, 2, 3, 4],洗牌後為 [4, 2, 1, 3]。將洗牌後的資料集送入 ML 模型以取得洗牌效能。](https://assets.datacamp.com/production/repositories/6745/datasets/8941afd8450944dd95675cf114c800a0de3d511c/PI_2.png)


| GRE 分數 | TOEFL 分數 | 大學評等 | SOP | LOR | CGPA | 錄取機率 | 錄取 |
|---|---|---|---|---|---|---|---|
| 337 | 118 | 4 | 4.5 | 4.5 | 9.65 | 0.92 | 1 |
| 324 | 107 | 4 | 4 | 4.5 | 8.87 | 0.76 | 1 |
| 316 | 104 | 3 | 3 | 3.5 | 8 | 0.72 | 1 |
| 322 | 110 | 3 | 3.5 | 2.5 | 8.67 | 0.8 | 1 |
| 314 | 103 | 2 | 2 | 3 | 8.21 | 0.45 | 0 |
資料位於:
X_train、y_train
from sklearn.neural_network import MLPClassifier model = MLPClassifier(hidden_layer_sizes=(10,10))model.fit(X_train, y_train)
from sklearn.inspection import permutation_importanceresult = permutation_importance(model,X_train, y_train,n_repeats=10,random_state=42,scoring='accuracy')print(result.importances_mean)
[0.16213568 0.13831658 0.10575377 0.10522613 0.11741206 0.20072864]
import matplotlib.pyplot as plt
plt.bar(X_train.columns,
result.importances_mean)
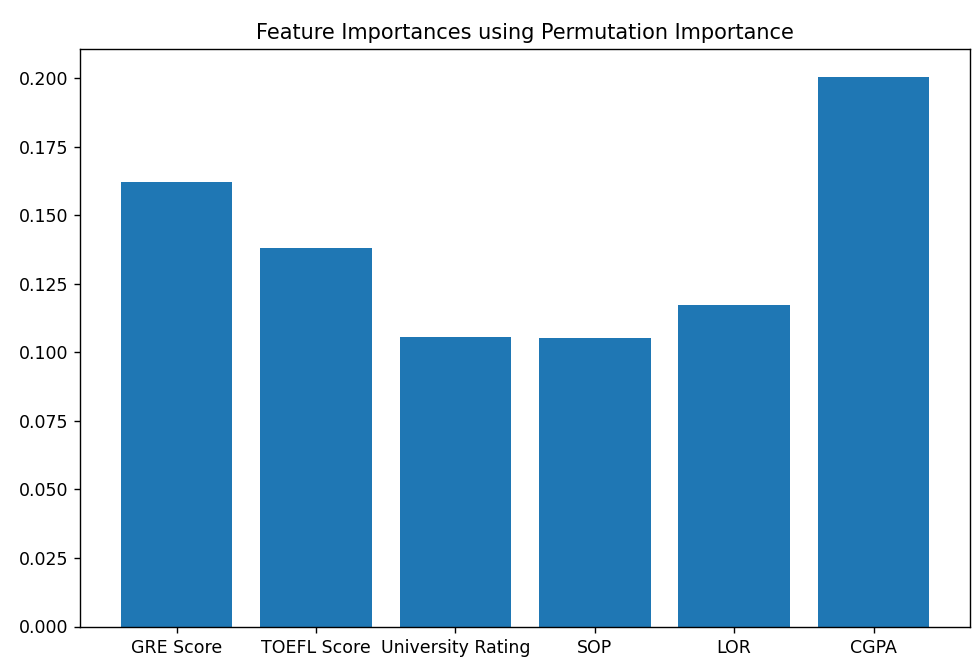
import matplotlib.pyplot as plt
plt.bar(X_train.columns,
result.importances_mean)

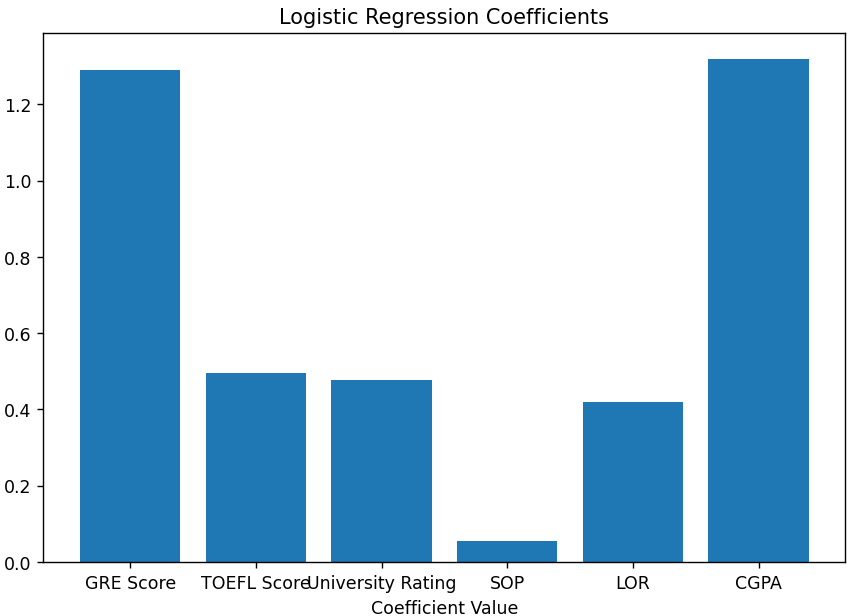
plt.bar(X_train.columns, np.abs(log_reg.coef_[0]))
Python 的 Explainable AI