以 LIME 進行在地可解釋性

Python 的 Explainable AI

Fouad Trad

Machine Learning Engineer

  • LIMELocal Interpretable Model-Agnostic Explanations
  • 解釋複雜模型的預測
  • 作用於單一樣本
  • 與模型類型無關

LIME 標誌。

Python 的 Explainable AI

Lime 解釋器

  • 因應不同資料型態設計

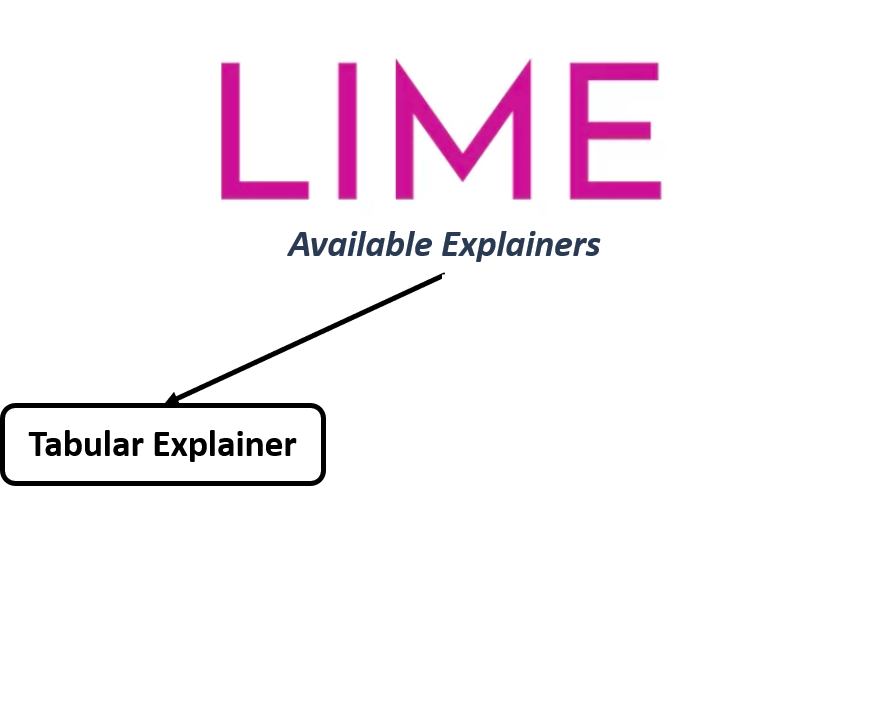
圖示顯示可用的 LIME 解釋器。第一個是 LIME 表格解釋器。

Python 的 Explainable AI

Lime 解釋器

  • 因應不同資料型態設計

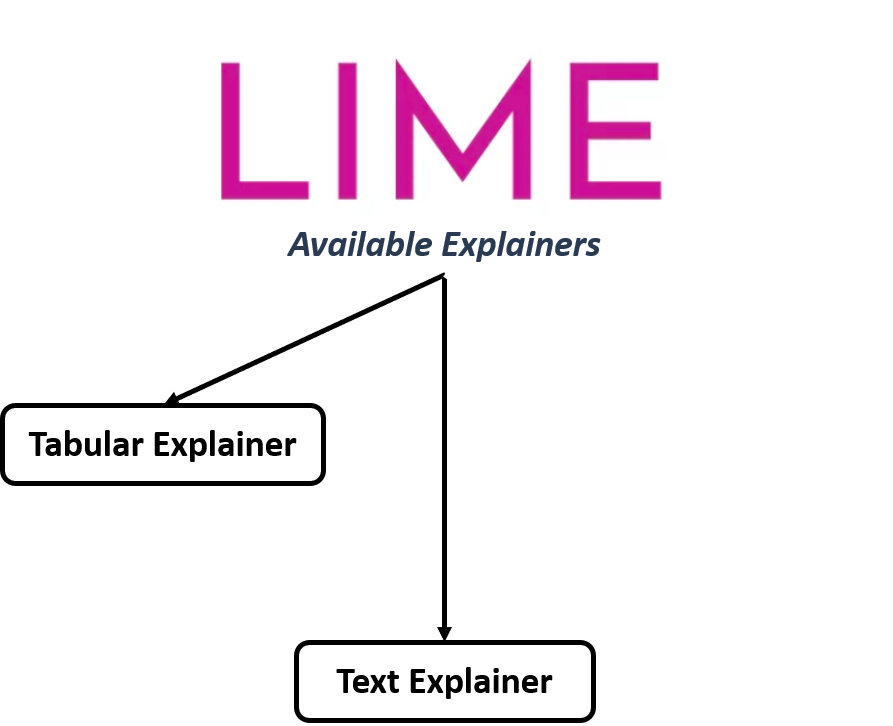
同一張圖,另加 Text Explainer。

Python 的 Explainable AI

Lime 解釋器

  • 因應不同資料型態設計
  • 在樣本附近產生擾動
  • 觀察對模型輸出的影響
  • 建立較簡單的解釋模型

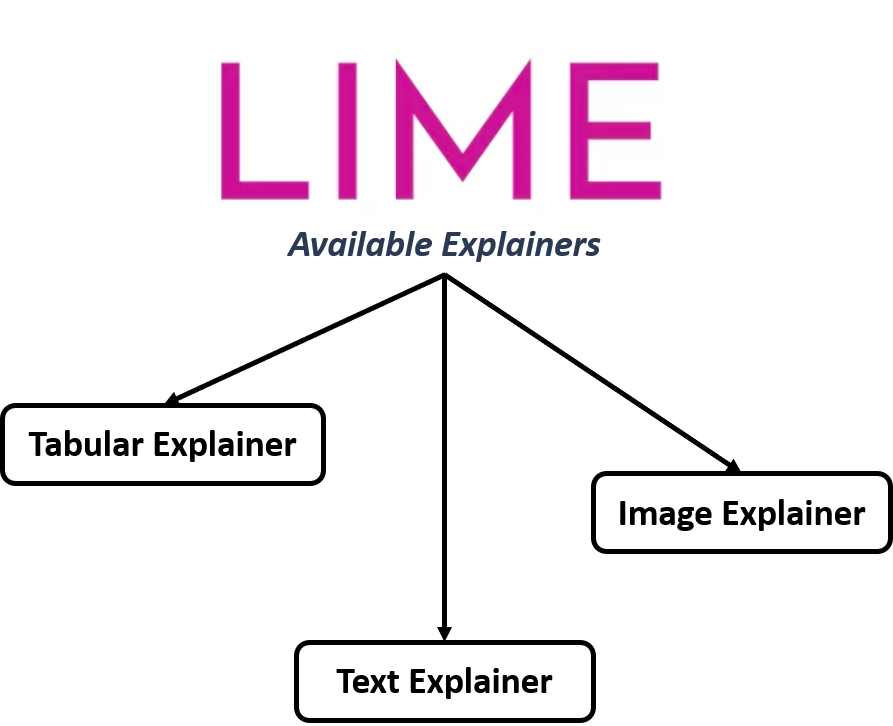
同一張圖,另加 Image Explainer。

Python 的 Explainable AI

Lime 解釋器

  • 因應不同資料型態設計
  • 在樣本附近產生擾動
  • 觀察對模型輸出的影響
  • 建立較簡單的解釋模型

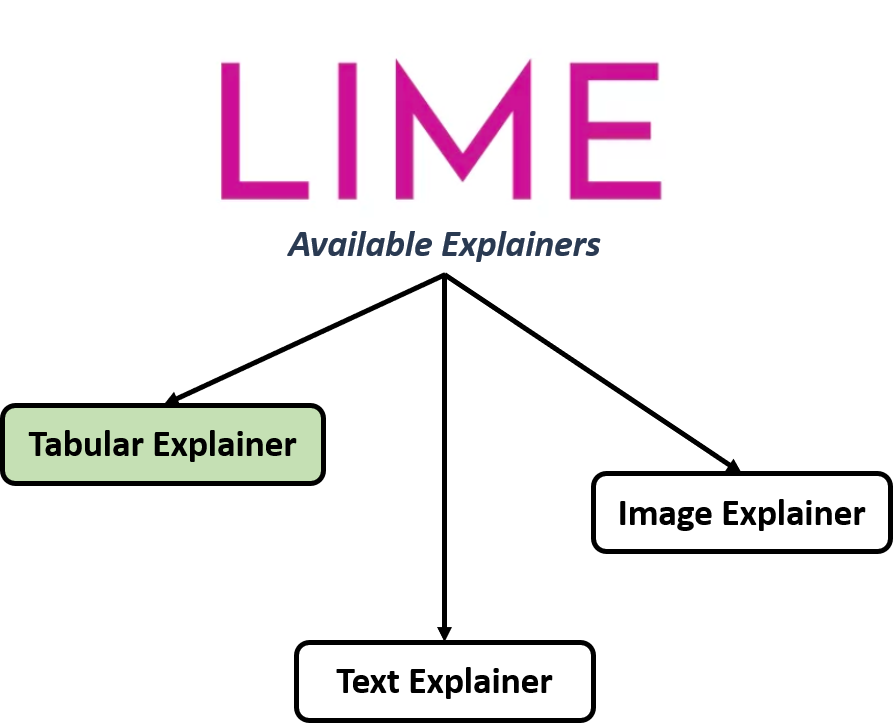
同一張圖,強調 Tabular explainer。

Python 的 Explainable AI

招生資料集

GRE Score TOEFL Score University Rating SOP LOR CGPA Chance of Admit Accept
337 118 4 4.5 4.5 9.65 0.92 1
324 107 4 4 4.5 8.87 0.76 1
316 104 3 3 3.5 8 0.72 1
322 110 3 3.5 2.5 8.67 0.8 1
314 103 2 2 3 8.21 0.45 0


  • regressor:預測錄取機率
  • classifier:預測是否錄取
  • 特徵在 X
Python 的 Explainable AI

建立表格解釋器

Regression
from lime.lime_tabular import LimeTabularExplainer

instance = X.iloc[1,:]
explainer_reg = LimeTabularExplainer( X.values,
feature_names=X.columns,
mode='regression'
)
explanation_reg = explainer_reg.explain_instance(
instance.values,
regressor.predict
)
Classification
from lime.lime_tabular import LimeTabularExplainer

instance = X.iloc[1,:]
explainer_class = LimeTabularExplainer( X.values,
feature_names=X.columns,
mode='classification'
)
explanation_class = explainer_class.explain_instance(
instance.values,
classifier.predict_proba
)
Python 的 Explainable AI

視覺化解釋結果

Regression
explanation_reg.as_pyplot_figure()
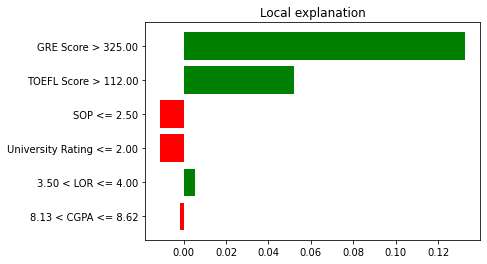
長條圖顯示各特徵對迴歸模型的影響。特徵置於區間中以提升可解讀性。

Classification
explanation_class.as_pyplot_figure()
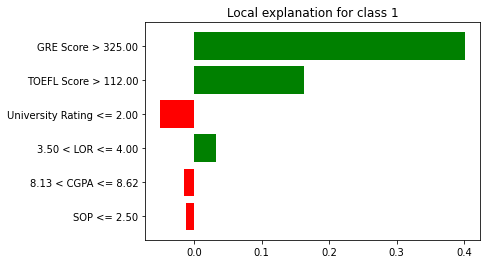
長條圖顯示各特徵對分類模型的影響。特徵置於區間中以提升可解讀性。

Python 的 Explainable AI

SHAP vs. LIME

SHAP
shap.waterfall_plot(...)
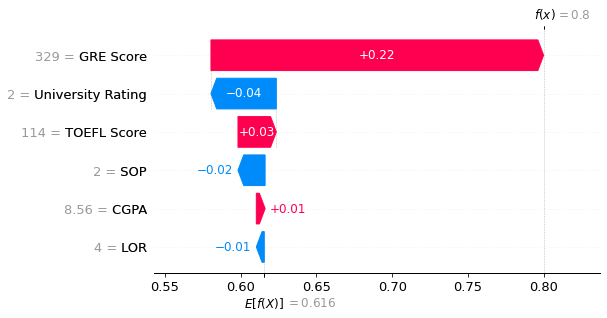
SHAP 瀑布圖,顯示各特徵如何正向或負向推動預測值。

LIME
explanation_class.as_pyplot_figure()

長條圖顯示各特徵對分類模型的影響。特徵置於區間中以提升可解讀性。

Python 的 Explainable AI

一起來練習吧!

Python 的 Explainable AI

Preparing Video For Download...