SHAP kernel explainer

Python 的 Explainable AI

Fouad Trad

Machine Learning Engineer

SHAP kernel explainer
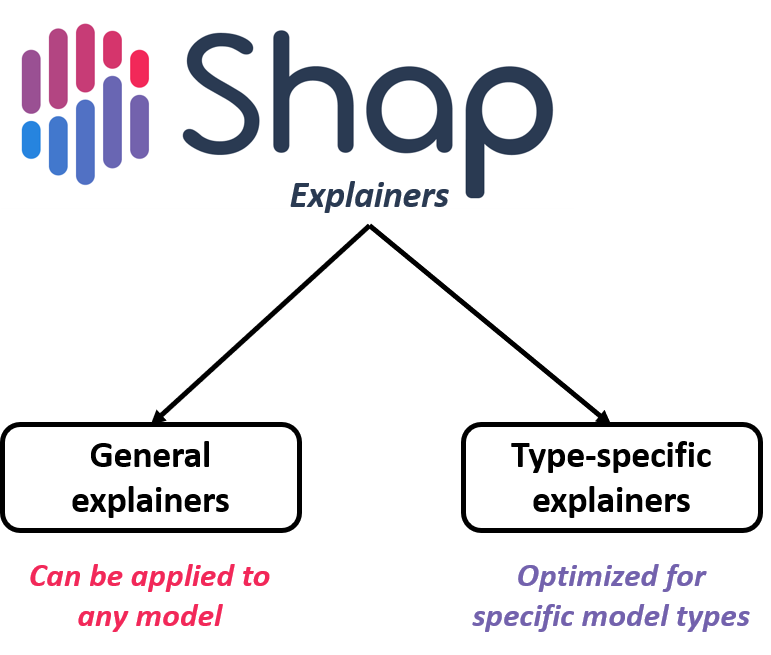
 

  • 為任何模型推導 SHAP 值

    • K-nearest neighbors
    • 神經網路
    • 樹式模型
  • 比類型專用 explainer 更慢

圖片說明:SHAP explainer 分為可用於任意模型的一般型,以及針對特定模型類型最佳化的專用型。

Python 的 Explainable AI

Heart disease

age sex chest_pain_type blood_pressure ecg_results thalassemia target
52 1 0 125 1 3 0
53 1 0 140 0 3 0
70 1 0 145 1 3 0
61 1 0 148 1 3 0
62 0 0 138 1 2 0


mlp_clf: 多層感知器,用於預測心臟病風險

Python 的 Explainable AI

Insurance charges

age gender bmi children smoker charges
19 0 27.900 0 1 16884.92
18 1 33.770 1 0 1725.55
28 1 33.000 3 0 4449.46
33 1 22.705 0 0 21984.47
32 1 28.880 0 0 3866.85


mlp_reg: 多層感知器,用於預測保險費用

Python 的 Explainable AI

建立 kernel explainer

MLPRegressor
import shap


explainer = shap.KernelExplainer( # Model's prediction function, # Representative summary of dataset )
MLPClassifier
import shap


explainer = shap.KernelExplainer( # Model's prediction function, # Representative summary of dataset )
Python 的 Explainable AI

建立 kernel explainer

MLPRegressor
import shap

explainer = shap.KernelExplainer(
  mlp_reg.predict, 
  # Representative summary of dataset
)


MLPClassifier
import shap

explainer = shap.KernelExplainer(
  mlp_clf.predict_proba, 
  # Representative summary of dataset
)


Python 的 Explainable AI

建立 kernel explainer

MLPRegressor
import shap

explainer = shap.KernelExplainer(
  mlp_reg.predict, 
  shap.kmeans(X, 10)
)


shap_values_reg = explainer.shap_values(X)
MLPClassifier
import shap

explainer = shap.KernelExplainer(
  mlp_clf.predict_proba, 
  shap.kmeans(X, 10)
)


shap_values_cls = explainer.shap_values(X)
Python 的 Explainable AI

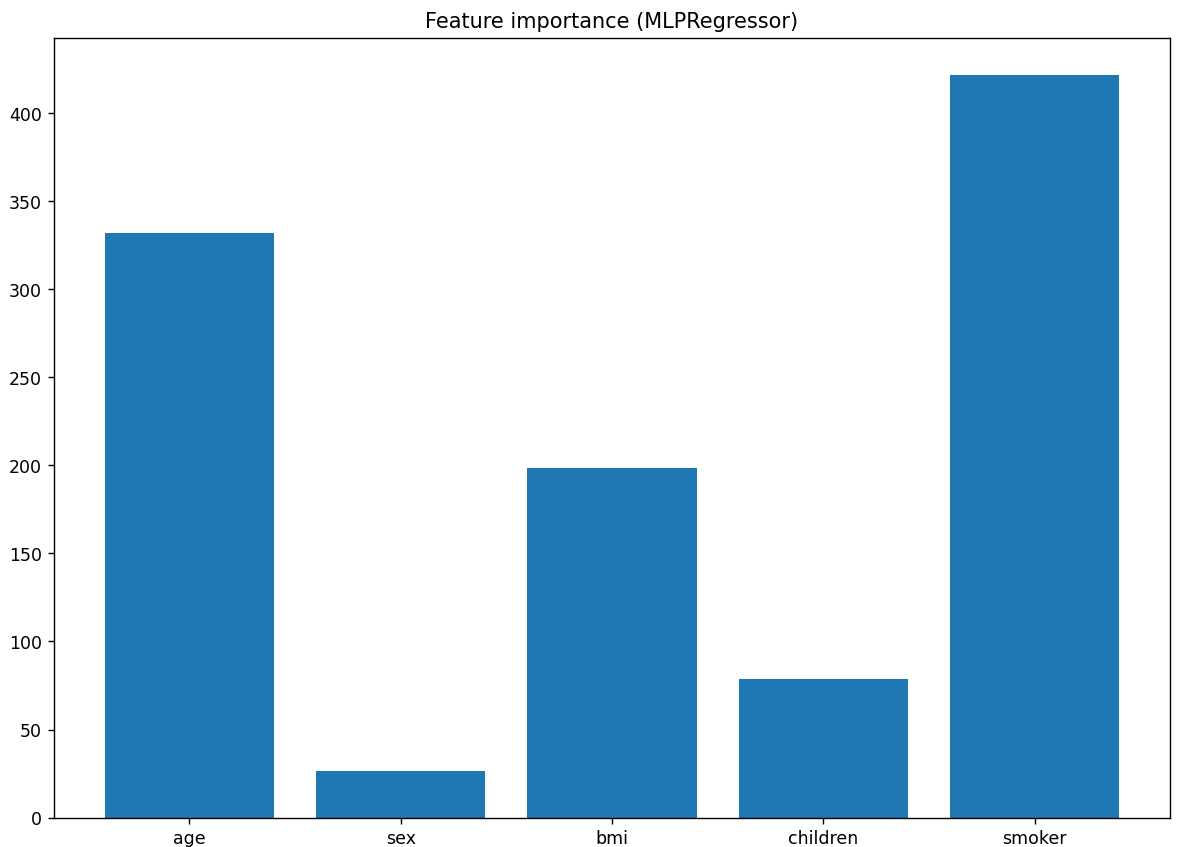
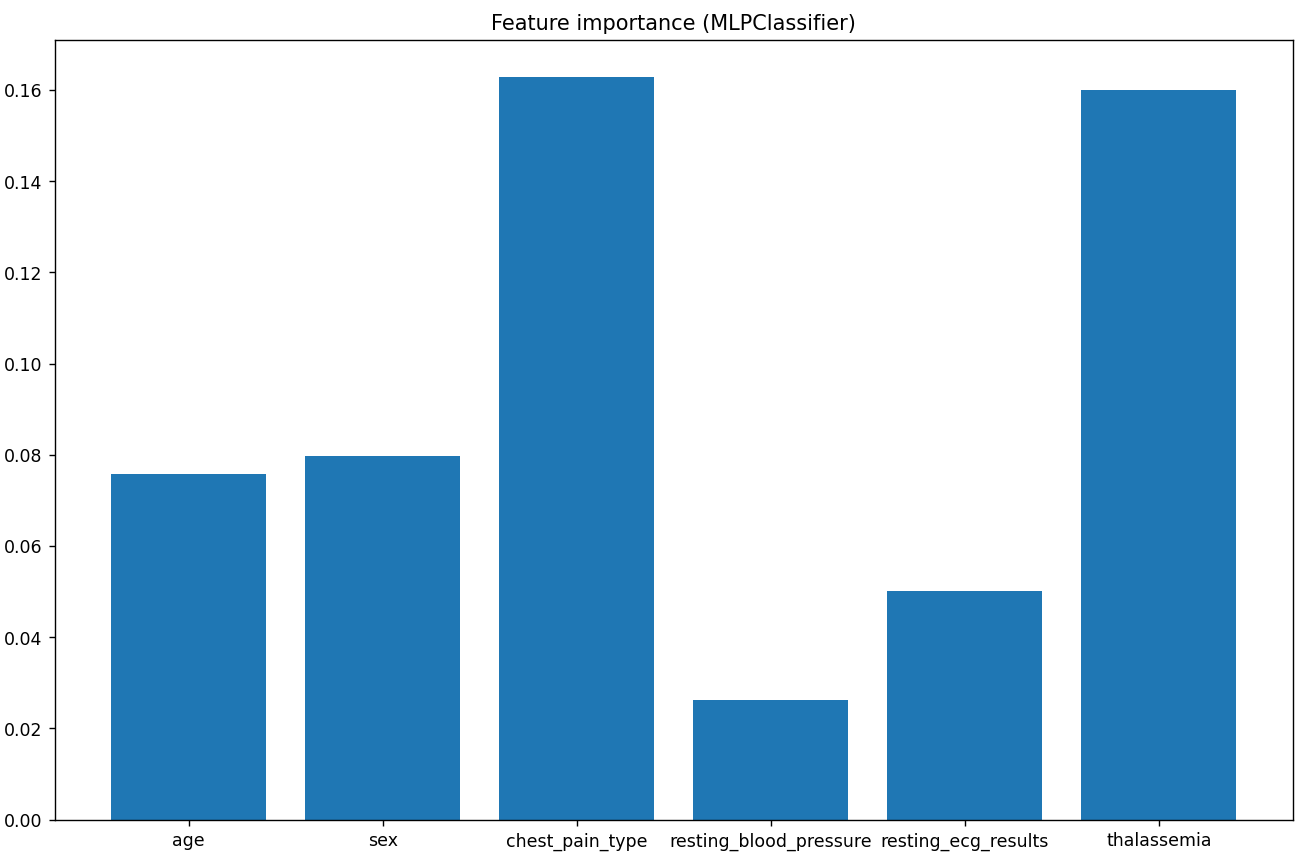
特徵重要度

MLPRegressor
mean_reg = np.abs(shap_values_reg).mean(axis=0)

plt.bar(X.columns, mean_reg)

圖片說明:迴歸任務的特徵重要度長條圖,顯示吸菸與年齡對預測費用影響最大。

MLPClassifier
mean_cls = np.abs(shap_values_cls[:,:,1]).mean(axis=0)

plt.bar(X.columns, mean_cls)

圖片說明:分類任務的特徵重要度長條圖,顯示胸痛類型與海洋性貧血對預測最具影響。

Python 的 Explainable AI

與模型專用方法比較

線性迴歸
plt.bar(X.columns, np.abs(lin_reg.coef_))
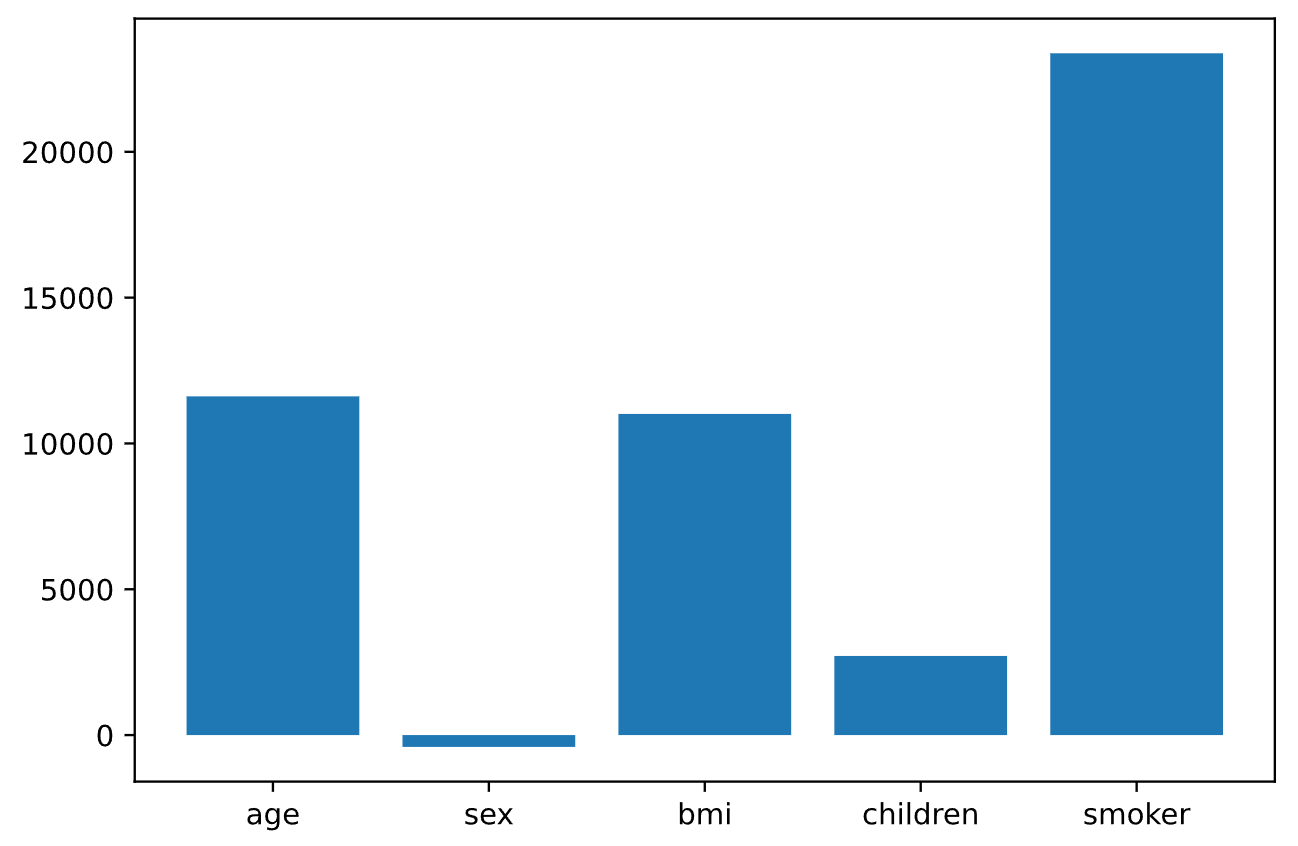
圖片說明:使用線性迴歸模型的特徵重要度長條圖,顯示吸菸與年齡對預測費用影響最大。

邏輯斯迴歸
plt.bar(X.columns, np.abs(log_reg.coef_[0]))
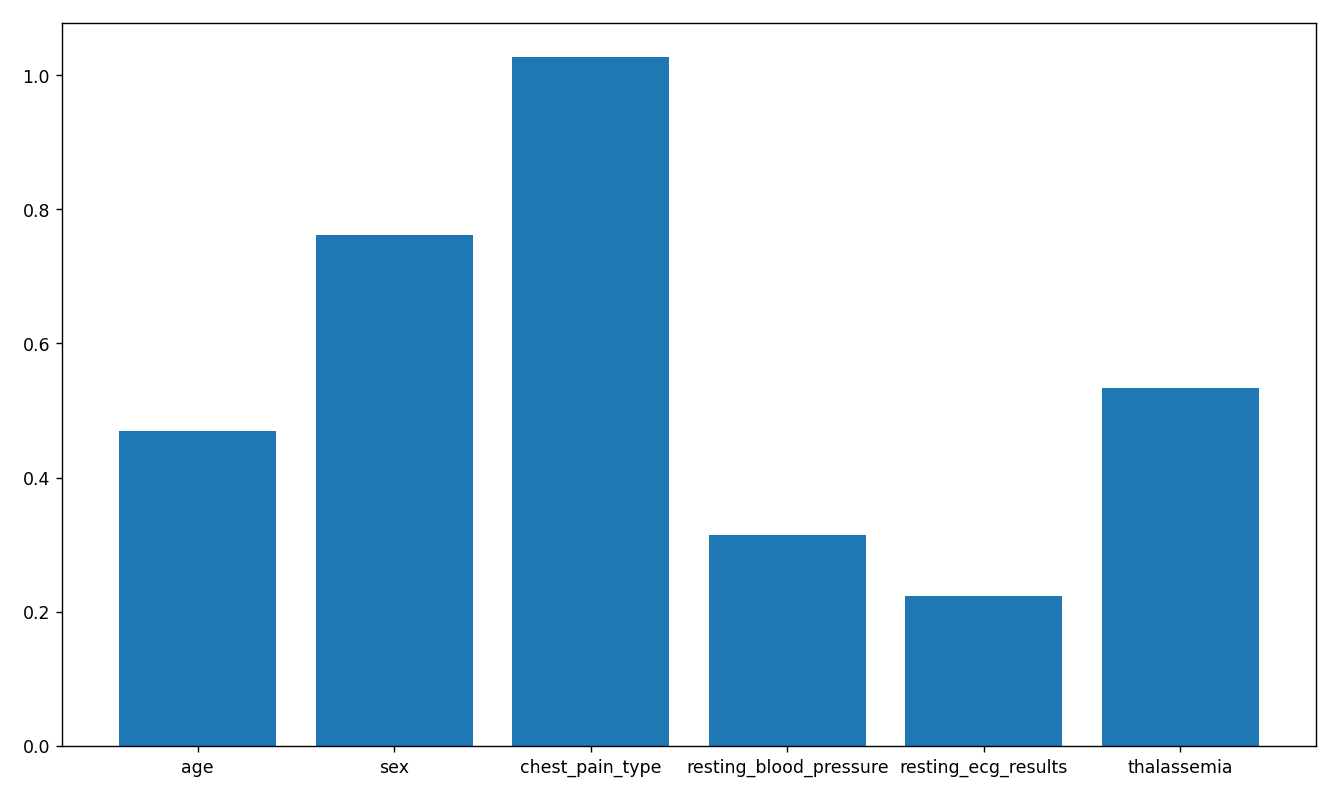
圖片說明:分類任務的特徵重要度長條圖,顯示胸痛類型對預測最具影響。

Python 的 Explainable AI

一起來練習吧!

Python 的 Explainable AI

Preparing Video For Download...