趨勢指標:移動平均

Financial Trading in Python

Chelsea Yang

Data Science Instructor

什麼是技術指標?

  • 以歷史市場資料做數學計算
  • 假設市場有效,價格已反映所有公開資訊
  • 協助交易者洞察過去的價格型態
Financial Trading in Python

指標類型

  • 趨勢指標:衡量趨勢方向或強度
    • 例:移動平均(MA)、平均方向性指數(ADX)
  • 動能指標:衡量價格變動速度
    • 例:相對強弱指數(RSI)
  • 波動度指標:衡量價格偏離幅度
    • 例:布林通道
Financial Trading in Python

TA-Lib 套件

TA-Lib:Technical Analysis Library

  • 含超過 150 種技術指標實作
import talib
Financial Trading in Python

移動平均指標

  • SMA:簡單移動平均
  • EMA:指數移動平均


  • 特性:
    • 隨價格移動
    • 平滑資料以更清楚指示價格方向
Financial Trading in Python

簡單移動平均(SMA)

$ SMA = (P_1+P_2+...+P_n)/n $

# Calculate two SMAs
stock_data['SMA_short'] = talib.SMA(stock_data['Close'], timeperiod=10)
stock_data['SMA_long'] = talib.SMA(stock_data['Close'], timeperiod=50)

# Print the last five rows print(stock_data.tail())
             Close  SMA_short  SMA_long
Date                                   
2020-11-24 1768.88    1758.77   1594.74
2020-11-25 1771.43    1760.65   1599.75
2020-11-27 1793.19    1764.98   1605.70
2020-11-30 1760.74    1763.35   1611.71
2020-12-01 1798.10    1765.02   1619.05

Financial Trading in Python

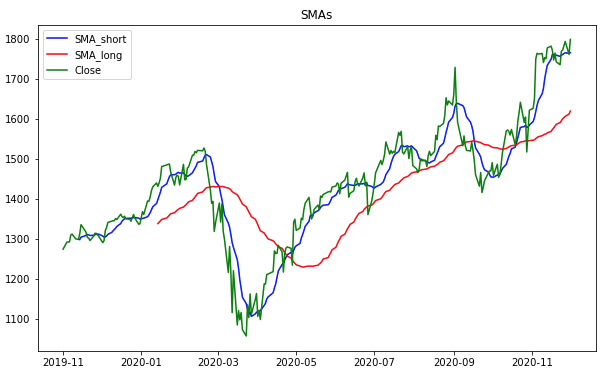
繪製 SMA

import matplotlib.pyplot as plt

# Plot SMA with the price
plt.plot(stock_data['SMA_short'], 
         label='SMA_short')
plt.plot(stock_data['SMA_long'], 
         label='SMA_long')
plt.plot(stock_data['Close'], 
         label='Close')

# Customize and show the plot
plt.legend()
plt.title('SMAs')
plt.show()

SMAs 圖

Financial Trading in Python

指數移動平均(EMA)

$EMA_n = P_n \times multiplier + \text{previous EMA} \times (1-multiplier)$

$multiplier = 2 / (n + 1)$

# Calculate two EMAs
stock_data['EMA_short'] = talib.EMA(stock_data['Close'], timeperiod=10)
stock_data['EMA_long'] = talib.EMA(stock_data['Close'], timeperiod=50)
# Print the last five rows
print(stock_data.tail())
             Close  EMA_short  EMA_long
Date                                   
2020-11-24 1768.88    1748.65   1640.98
2020-11-25 1771.43    1752.79   1646.09
2020-11-27 1793.19    1760.13   1651.86
2020-11-30 1760.74    1760.24   1656.13
2020-12-01 1798.10    1767.13   1661.70
Financial Trading in Python

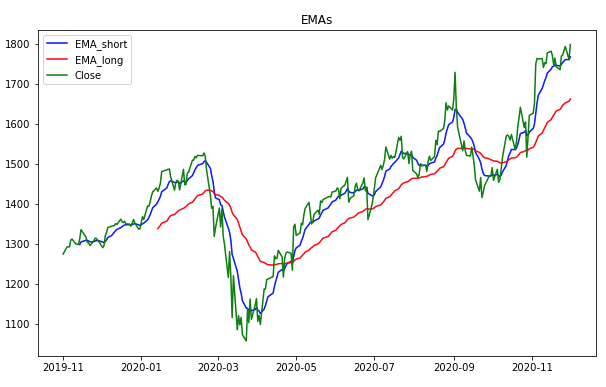
繪製 EMA

import matplotlib.pyplot as plt
# Plot EMA with the price
plt.plot(stock_data['EMA_short'], 
         label='EMA_short')
plt.plot(stock_data['EMA_long'], 
         label='EMA_long')
plt.plot(stock_data['Close'], 
         label='Close')

# Customize and show the plot
plt.legend()
plt.title('EMAs')
plt.show()

EMA 圖

Financial Trading in Python

SMA vs. EMA

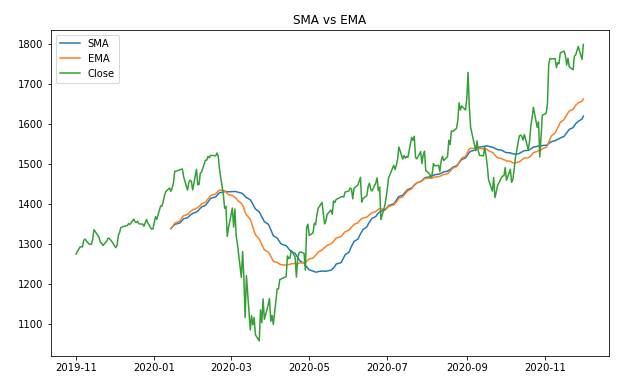
EMA 對最近的價格變動更敏感

用相同回朔視窗計算的 SMA 與 EMA 對照圖

Financial Trading in Python

一起來練習吧!

Financial Trading in Python

Preparing Video For Download...