強度指標:ADX

Financial Trading in Python

Chelsea Yang

Data Science Instructor

什麼是 ADX?

  • 為「Average Directional Movement Index」的縮寫
  • 由 J. Welles Wilder 提出
    • 「New Concepts in Technical Systems」(1987)

Wells Wilder 書籍

  • 衡量趨勢強度
    • 在 0 到 100 之間震盪
    • ADX <= 25:無明顯趨勢
    • ADX > 25:有趨勢的市場
    • ADX > 50:強勢趨勢市場
Financial Trading in Python

ADX 如何計算?

  • 由 +DI 與 -DI 差異的平滑平均推導而來
    • +DI(Plus Directional Index):量化上升趨勢
    • -DI(Minus Directional Index):量化下降趨勢


  • 計算所需輸入:
    • 各期的最高價、最低價與收盤價
Financial Trading in Python

在 Python 實作 ADX

# Calculate ADX
stock_data['ADX'] = talib.ADX(stock_data['High'], stock_data['Low'], stock_data['Close'],
                              timeperiod=14)

# Print the last five rows print(stock_data.tail())
             Open   High    Low  Close   ADX
Date                                        
2020-11-24 540.40 559.99 526.20 555.38 21.16
2020-11-25 550.06 574.00 545.37 574.00 23.92
2020-11-27 581.16 598.78 578.45 585.76 26.82
2020-11-30 602.21 607.80 554.51 567.60 28.25
2020-12-01 597.59 597.85 572.05 584.76 29.58
Financial Trading in Python

繪製 ADX

import matplotlib.pyplot as plt

# Create subplots
fig, (ax1, ax2) = plt.subplots(2)

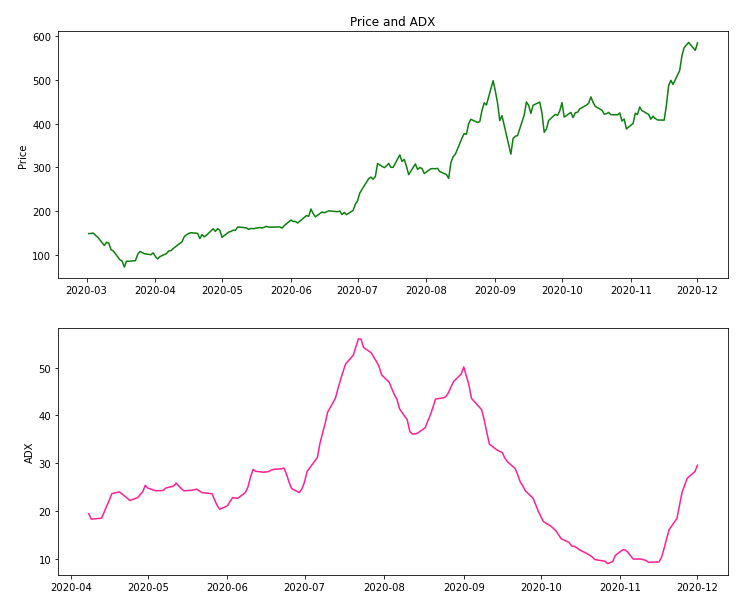
# Plot ADX with the price ax1.set_ylabel('Price') ax1.plot(stock_data['Close']) ax2.set_ylabel('ADX') ax2.plot(stock_data['ADX']) ax1.set_title('Price and ADX') plt.show()

上方為價格走勢圖,下方為 ADX 圖

Financial Trading in Python

一起來練習吧!

Financial Trading in Python

Preparing Video For Download...