什麼是金融交易

Financial Trading in Python

Chelsea Yang

Data Science Instructor

金融交易的概念

金融交易是買賣金融資產的行為

可交易的金融商品:

  • 股票
  • 債券
  • 外匯
  • 原物料
  • 加密貨幣
Financial Trading in Python

人們為什麼交易

透過可控風險來獲利

  • 做多:價格上漲時獲利
  • 放空:價格下跌時獲利


市場參與者:

  • 機構交易者
  • 散戶交易者
Financial Trading in Python

交易 vs. 投資

交易:
  • 持有期較短
  • 著重短期趨勢或價格波動
  • 可做多也可放空
投資:
  • 持有期較長
  • 著重基本面
  • 多以做多為主
Financial Trading in Python

金融時間序列資料

時間序列資料:依時間順序索引的一連串資料點

import pandas as pd
# Load the data
bitcoin_data = pd.read_csv("bitcoin_data.csv", index_col='Date', parse_dates=True)
print(bitcoin_data.head())
               Open     High      Low    Close      Volume
Date                                                      
2019-01-01  3746.71  3850.91  3707.23  3843.52  4324200990
2019-01-02  3849.22  3947.98  3817.41  3943.41  5244856835
2019-01-03  3931.05  3935.69  3826.22  3836.74  4530215218
2019-01-04  3832.04  3865.93  3783.85  3857.72  4847965467
2019-01-05  3851.97  3904.90  3836.90  3845.19  5137609823
Financial Trading in Python

繪製時間序列的折線圖

import matplotlib.pyplot as plt
plt.plot(bitcoin_data['Close'], color='red')
plt.title("Daily close price")
plt.show()
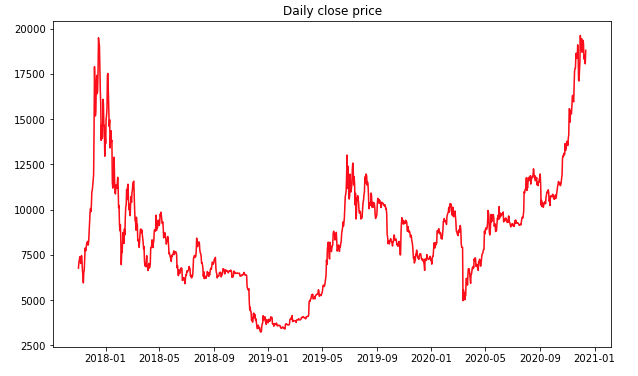
股票收盤價折線圖範例

Financial Trading in Python

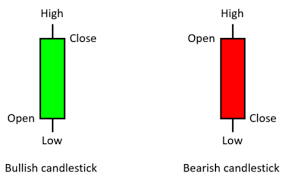
K 線圖

K 線圖:左為綠色多頭 K 線,右為紅色空頭 K 線。

  • 每根 K 線顯示高、低、開、收

  • 顏色表示多頭(上漲)或空頭(下跌)走勢

Financial Trading in Python

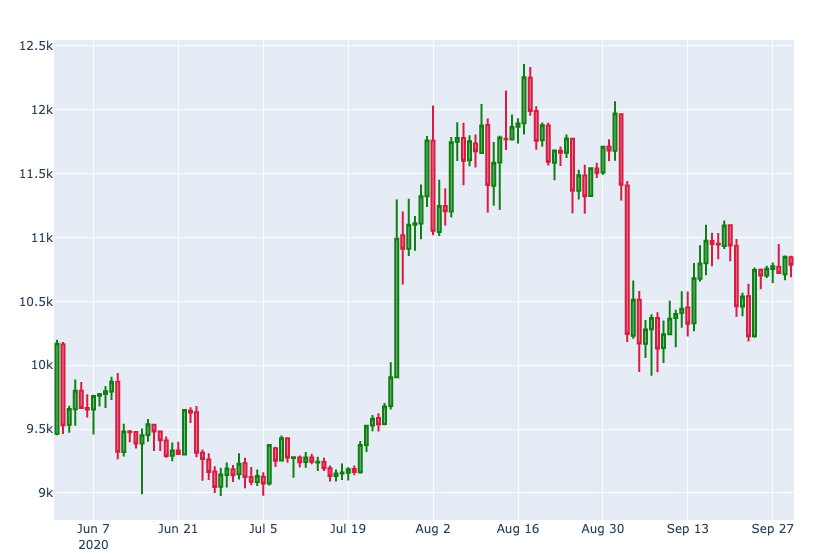
用 Python 繪製 K 線圖

import plotly.graph_objects as go

# Define the candlestick candlestick = go.Candlestick( x = bitcoin_data.index, open = bitcoin_data['Open'], high = bitcoin_data['High'], low = bitcoin_data['Low'], close = bitcoin_data['Close'])
# Create a plot fig = go.Figure(data=[candlestick])
# Show the plot fig.show()

繪製 K 線圖

Financial Trading in Python

一起來練習吧!

Financial Trading in Python

Preparing Video For Download...