Financial Trading in Python
Chelsea Yang
Data Science Instructor
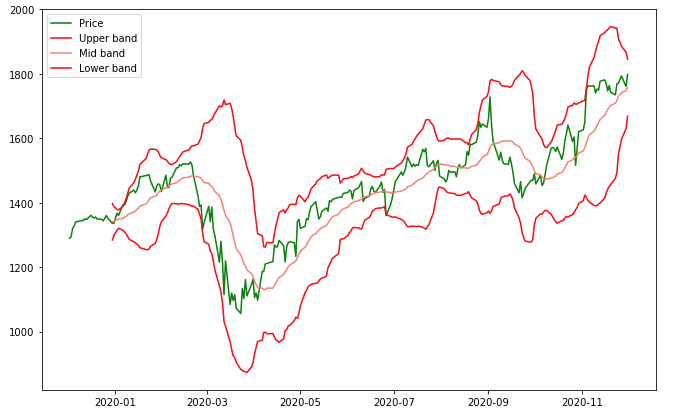
由 John Bollinger 提出
# Define the Bollinger Bands
upper, mid, lower = talib.BBANDS(stock_data['Close'],
                                 nbdevup=2,
                                 nbdevdn=2,
                                 timeperiod=20)
import matplotlib.pyplot as plt

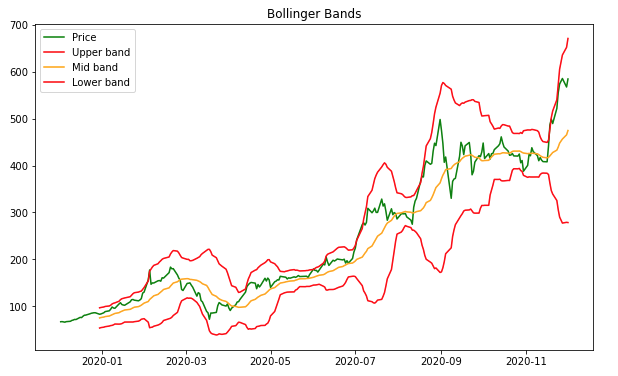
# Plot the Bollinger Bands
plt.plot(stock_data['Close'], label='Price')
plt.plot(upper, label="Upper band")
plt.plot(mid, label='Middle band')
plt.plot(lower, label='Lower band')


# Customize and show the plot
plt.title('Bollinger Bands')
plt.legend()
plt.show()
import matplotlib.pyplot as plt # Plot the Bollinger Bands plt.plot(stock_data['Close'], label='Price') plt.plot(upper, label="Upper band") plt.plot(mid, label='Middle band') plt.plot(lower, label='Lower band')
# Customize and show the plot plt.title('Bollinger Bands') plt.legend() plt.show()