頻譜圖:聲音隨時間的頻譜變化

Python 的時間序列資料機器學習

Chris Holdgraf

Fellow, Berkeley Institute for Data Science

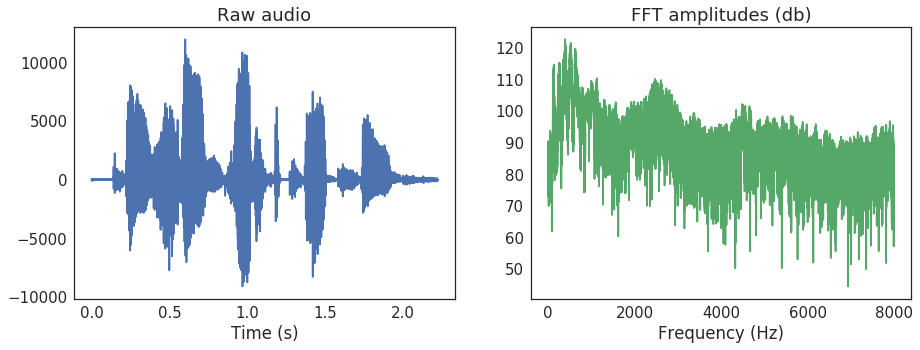
傅立葉轉換

  • 時間序列可視為快變與慢變成分的組合。
  • 在每個時刻,都能描述快、慢成分的相對占比。
  • 最簡單的方法稱為「傅立葉轉換」。
  • 它把單一時間序列轉成由多個振盪組成的陣列描述。
Python 的時間序列資料機器學習

傅立葉轉換(FFT)

Python 的時間序列資料機器學習

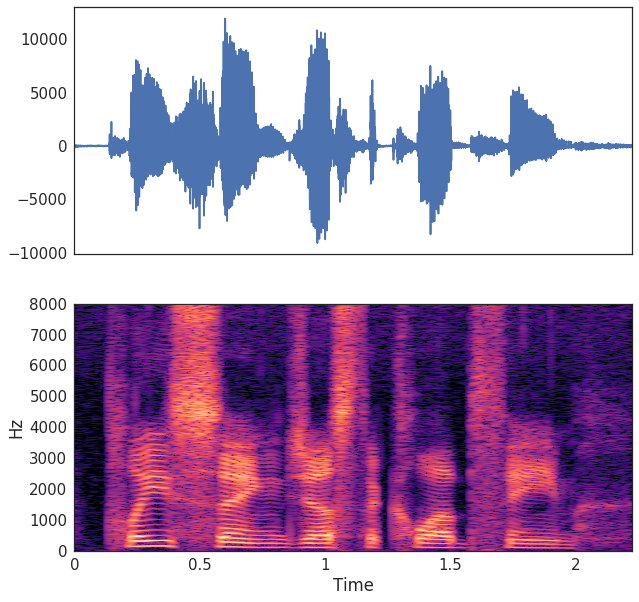
頻譜圖:由多個加窗傅立葉轉換組成

  • 頻譜圖是隨時間進行多個加窗傅立葉轉換的集合。
  • 類似移動平均的計算方式:
    1. 選擇窗格大小與形狀
    2. 在某時點對該窗格做 FFT
    3. 將窗格滑動一格
    4. 匯總結果
  • 稱為「短時傅立葉轉換」(STFT)。
Python 的時間序列資料機器學習

Python 的時間序列資料機器學習

計算 STFT

  • 你可以用 librosa 計算 STFT。
  • 可調整多個參數(例如窗格大小)。
  • 本課會轉成「分貝」以正規化各頻率的平均值。
  • 接著用 specshow() 來視覺化。
Python 的時間序列資料機器學習

用程式計算 STFT

# Import the functions we'll use for the STFT
from librosa.core import stft, amplitude_to_db
from librosa.display import specshow
import matplotlib.pyplot as plt

# Calculate our STFT
HOP_LENGTH = 2**4
SIZE_WINDOW = 2**7
audio_spec = stft(audio, hop_length=HOP_LENGTH, n_fft=SIZE_WINDOW)

# Convert into decibels for visualization
spec_db = amplitude_to_db(audio_spec)

# Visualize
fig, ax = plt.subplots()
specshow(spec_db, sr=sfreq, x_axis='time', 
         y_axis='hz', hop_length=HOP_LENGTH, ax=ax)
Python 的時間序列資料機器學習

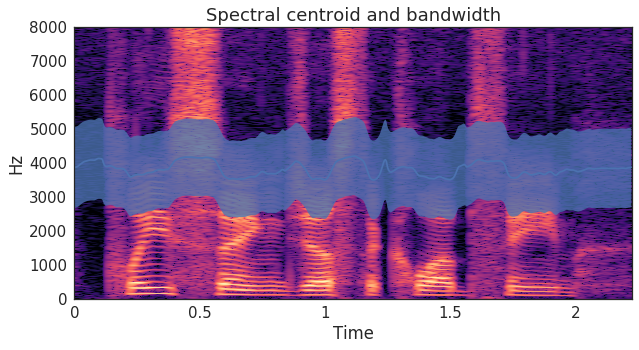
頻譜特徵工程

  • 每個時間序列都有不同的頻譜樣貌。
  • 你可以透過分析頻譜圖來計算這些頻譜特徵。
  • 例如,頻譜頻寬頻譜重心描述每一時刻能量的主要分佈位置。

Python 的時間序列資料機器學習

計算頻譜特徵

# Calculate the spectral centroid and bandwidth for the spectrogram
bandwidths = lr.feature.spectral_bandwidth(S=spec)[0]
centroids = lr.feature.spectral_centroid(S=spec)[0]

# Display these features on top of the spectrogram
fig, ax = plt.subplots()
specshow(spec, x_axis='time', y_axis='hz', hop_length=HOP_LENGTH, ax=ax)
ax.plot(times_spec, centroids)
ax.fill_between(times_spec, centroids - bandwidths / 2, 
                centroids + bandwidths / 2, alpha=0.5)
Python 的時間序列資料機器學習

將頻譜與時間特徵結合進分類器

centroids_all = []
bandwidths_all = []
for spec in spectrograms:
    bandwidths = lr.feature.spectral_bandwidth(S=lr.db_to_amplitude(spec))
    centroids = lr.feature.spectral_centroid(S=lr.db_to_amplitude(spec))
    # Calculate the mean spectral bandwidth
    bandwidths_all.append(np.mean(bandwidths))  
    # Calculate the mean spectral centroid
    centroids_all.append(np.mean(centroids))  

# Create our X matrix
X = np.column_stack([means, stds, maxs, tempo_mean, 
                     tempo_max, tempo_std, bandwidths_all, centroids_all])
Python 的時間序列資料機器學習

一起來練習吧!

Python 的時間序列資料機器學習

Preparing Video For Download...