清理並改善你的資料

Python 的時間序列資料機器學習

Chris Holdgraf

Fellow, Berkeley Institute for Data Science

資料很雜亂

  • 真實世界的資料常常很雜亂
  • 最常見的兩個問題是「遺漏值」與「離群值」
  • 這通常來自人工疏失、感測器故障、資料庫失效等
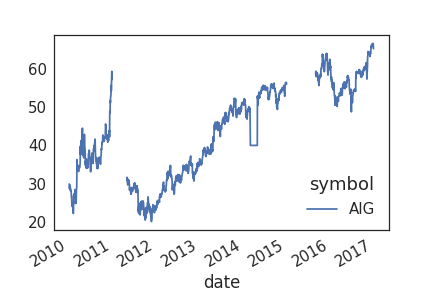
  • 先視覺化原始資料,有助於快速發現問題
Python 的時間序列資料機器學習

雜亂資料長什麼樣

Python 的時間序列資料機器學習

插值:用時間補齊遺漏資料

  • 處理遺漏值的常見方法是以「插值」補齊
  • 對時間序列,可以利用時間來輔助插值。
  • 這裡的 插值 指的是用缺口兩側的「已知」數值,推估中間遺漏的部分。
Python 的時間序列資料機器學習

在 Pandas 中做插值

# Return a boolean that notes where missing values are
missing = prices.isna()

# Interpolate linearly within missing windows
prices_interp = prices.interpolate('linear')

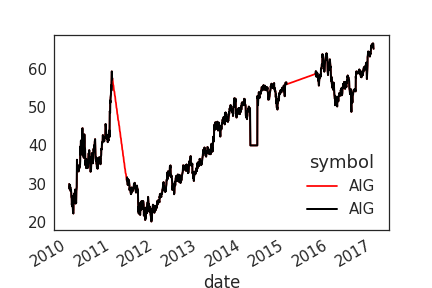
# Plot the interpolated data in red and the data w/ missing values in black
ax = prices_interp.plot(c='r')
prices.plot(c='k', ax=ax, lw=2)
Python 的時間序列資料機器學習

視覺化插值結果

Python 的時間序列資料機器學習

使用滾動視窗轉換資料

  • 滾動視窗的另一用途是轉換資料
  • 我們已用它來「平滑」資料
  • 也能用來做更進階的轉換
Python 的時間序列資料機器學習

轉換資料以標準化變異

  • 常見轉換之一是讓資料的平均與變異隨時間標準化,做法很多。
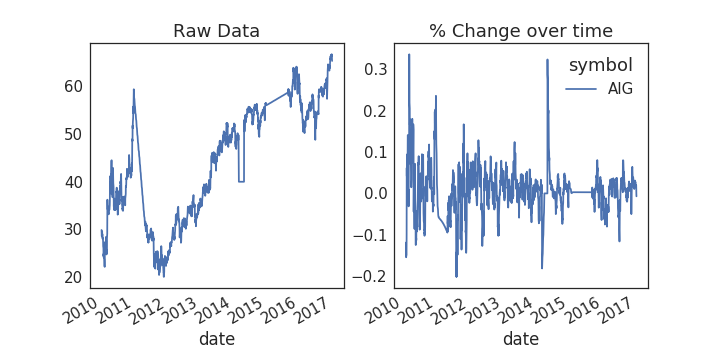
  • 這裡示範把資料轉成「相對前一視窗的 % 變化」。
  • 當絕對值波動很大時,能讓各時間點更可比。
Python 的時間序列資料機器學習

用 Pandas 轉成百分比變化

def percent_change(values):
    """Calculates the % change between the last value 
    and the mean of previous values"""
    # Separate the last value and all previous values into variables
    previous_values = values[:-1]
    last_value = values[-1]

    # Calculate the % difference between the last value 
    # and the mean of earlier values
    percent_change = (last_value - np.mean(previous_values)) \
    / np.mean(previous_values)
    return percent_change
Python 的時間序列資料機器學習

套用到我們的資料

# Plot the raw data
fig, axs = plt.subplots(1, 2, figsize=(10, 5))
ax = prices.plot(ax=axs[0])

# Calculate % change and plot
ax = prices.rolling(window=20).aggregate(percent_change).plot(ax=axs[1])
ax.legend_.set_visible(False)
Python 的時間序列資料機器學習

找出資料中的離群值

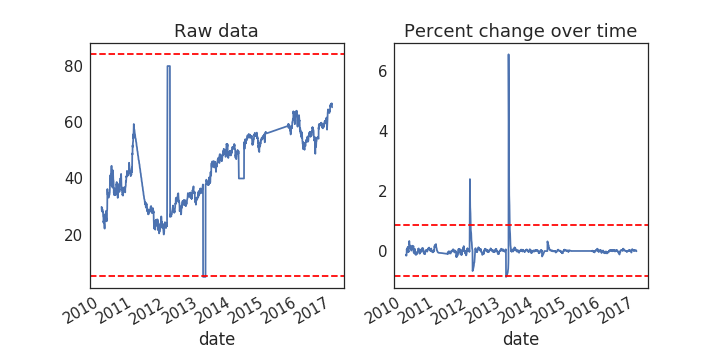
  • 離群值是與資料集顯著不同的觀測點。
  • 它會削弱模型的預測力,讓結果偏離「真正」的值。
  • 可行作法是「移除」或「以更具代表性的值取代」離群值。

務必謹慎:常常難以分辨極端值是真實現象,還是異常。

Python 的時間序列資料機器學習

在資料上畫出門檻

fig, axs = plt.subplots(1, 2, figsize=(10, 5))
for data, ax in zip([prices, prices_perc_change], axs):
    # Calculate the mean / standard deviation for the data
    this_mean = data.mean()
    this_std = data.std()

    # Plot the data, with a window that is 3 standard deviations 
    # around the mean
    data.plot(ax=ax)
    ax.axhline(this_mean + this_std * 3, ls='--', c='r')
    ax.axhline(this_mean - this_std * 3, ls='--', c='r')
Python 的時間序列資料機器學習

視覺化離群值門檻

Python 的時間序列資料機器學習

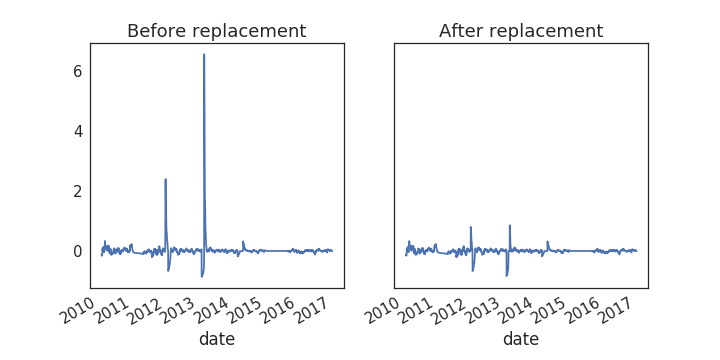
用門檻取代離群值

# Center the data so the mean is 0
prices_outlier_centered = prices_outlier_perc - prices_outlier_perc.mean()

# Calculate standard deviation
std = prices_outlier_perc.std()

# Use the absolute value of each datapoint 
# to make it easier to find outliers
outliers = np.abs(prices_outlier_centered) > (std * 3)

# Replace outliers with the median value
# We'll use np.nanmean since there may be nans around the outliers
prices_outlier_fixed = prices_outlier_centered.copy()
prices_outlier_fixed[outliers] = np.nanmedian(prices_outlier_fixed)

Python 的時間序列資料機器學習

視覺化結果

fig, axs = plt.subplots(1, 2, figsize=(10, 5))
prices_outlier_centered.plot(ax=axs[0])
prices_outlier_fixed.plot(ax=axs[1])
Python 的時間序列資料機器學習

一起來練習吧!

Python 的時間序列資料機器學習

Preparing Video For Download...