平穩性與穩定性

Python 的時間序列資料機器學習

Chris Holdgraf

Fellow, Berkeley Institute for Data Science
平穩性

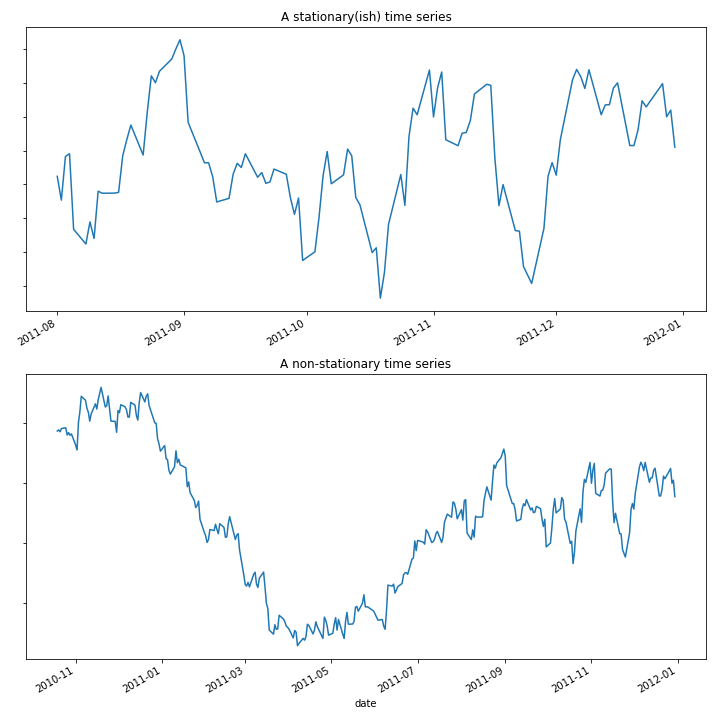
  • 平穩時間序列的統計性質不會隨時間改變
  • 例如:平均數、標準差、趨勢
  • 多數時間序列在某種程度上都是非平穩
Python 的時間序列資料機器學習

Python 的時間序列資料機器學習

模型穩定性

  • 非平穩資料會讓模型表現更易波動
  • 模型找到的統計性質可能隨資料改變
  • 此外,你對模型參數的正確值會更不確定
  • 要如何量化這件事?
Python 的時間序列資料機器學習

用交叉驗證量化參數穩定性

  • 一種作法:使用交叉驗證
  • 在每次迭代計算模型參數
  • 檢視所有 CV 分割中的參數穩定性
Python 的時間序列資料機器學習

平均數的 Bootstrapping

  • Bootstrapping 是常見的變異性評估方法
  • Bootstrap 流程:
    1. 可重複抽樣方式隨機抽取樣本
    2. 計算樣本的平均數
    3. 重複多次(上千次)
    4. 計算結果的分位數(通常 2.5、97.5)

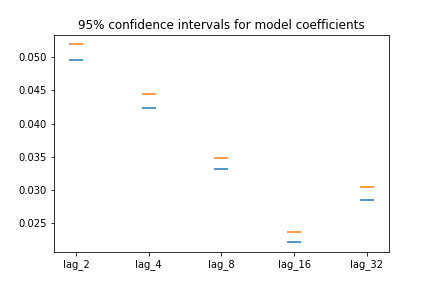
結果是各係數平均數的「95% 信賴區間」。

Python 的時間序列資料機器學習

平均數的 Bootstrapping

from sklearn.utils import resample

# cv_coefficients has shape (n_cv_folds, n_coefficients)
n_boots = 100
bootstrap_means = np.zeros(n_boots, n_coefficients)
for ii in range(n_boots):
    # Generate random indices for our data with replacement, 
    # then take the sample mean
    random_sample = resample(cv_coefficients)
    bootstrap_means[ii] = random_sample.mean(axis=0)

# Compute the percentiles of choice for the bootstrapped means
percentiles = np.percentile(bootstrap_means, (2.5, 97.5), axis=0)
Python 的時間序列資料機器學習

繪製 bootstrap 係數

fig, ax = plt.subplots()
ax.scatter(many_shifts.columns, percentiles[0], marker='_', s=200)
ax.scatter(many_shifts.columns, percentiles[1], marker='_', s=200)
Python 的時間序列資料機器學習

評估模型表現穩定性

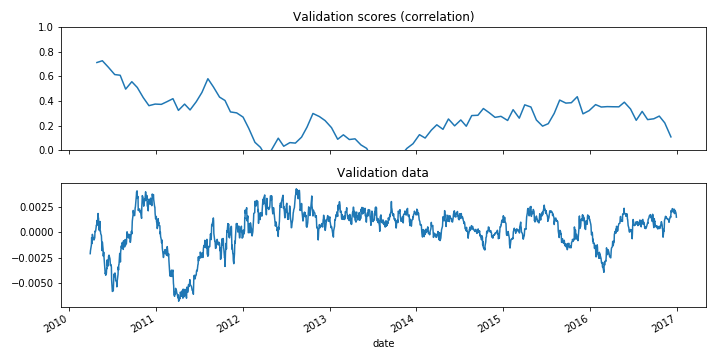
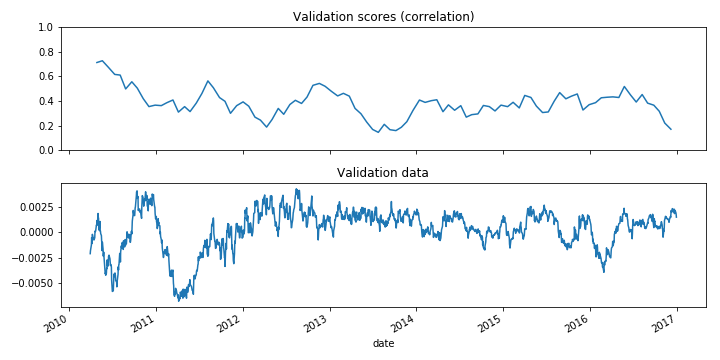
  • 若使用 TimeSeriesSplit,可「繪圖」觀察模型分數隨時間的變化。
  • 有助找出拉低分數的時間區段
  • 也可用來發現非平穩訊號
Python 的時間序列資料機器學習

模型表現的時間變化

def my_corrcoef(est, X, y):
    """Return the correlation coefficient 
    between model predictions and a validation set."""
    return np.corrcoef(y, est.predict(X))[1, 0]

# Grab the date of the first index of each validation set
first_indices = [data.index[tt[0]] for tr, tt in cv.split(X, y)]

# Calculate the CV scores and convert to a Pandas Series
cv_scores = cross_val_score(model, X, y, cv=cv, scoring=my_corrcoef)
cv_scores = pd.Series(cv_scores, index=first_indices)
Python 的時間序列資料機器學習

以時間序列視覺化模型分數

fig, axs = plt.subplots(2, 1, figsize=(10, 5), sharex=True)

# Calculate a rolling mean of scores over time
cv_scores_mean = cv_scores.rolling(10, min_periods=1).mean()
cv_scores.plot(ax=axs[0])
axs[0].set(title='Validation scores (correlation)', ylim=[0, 1])

# Plot the raw data
data.plot(ax=axs[1])
axs[1].set(title='Validation data')
Python 的時間序列資料機器學習

視覺化模型分數

Python 的時間序列資料機器學習

時間序列交叉驗證的固定視窗

# Only keep the last 100 datapoints in the training data
window = 100

# Initialize the CV with this window size
cv = TimeSeriesSplit(n_splits=10, max_train_size=window)
Python 的時間序列資料機器學習

非平穩訊號

Python 的時間序列資料機器學習

一起來練習吧!

Python 的時間序列資料機器學習

Preparing Video For Download...