監控與視覺化

端到端機器學習

Joshua Stapleton

Machine Learning Engineer

接下來呢?

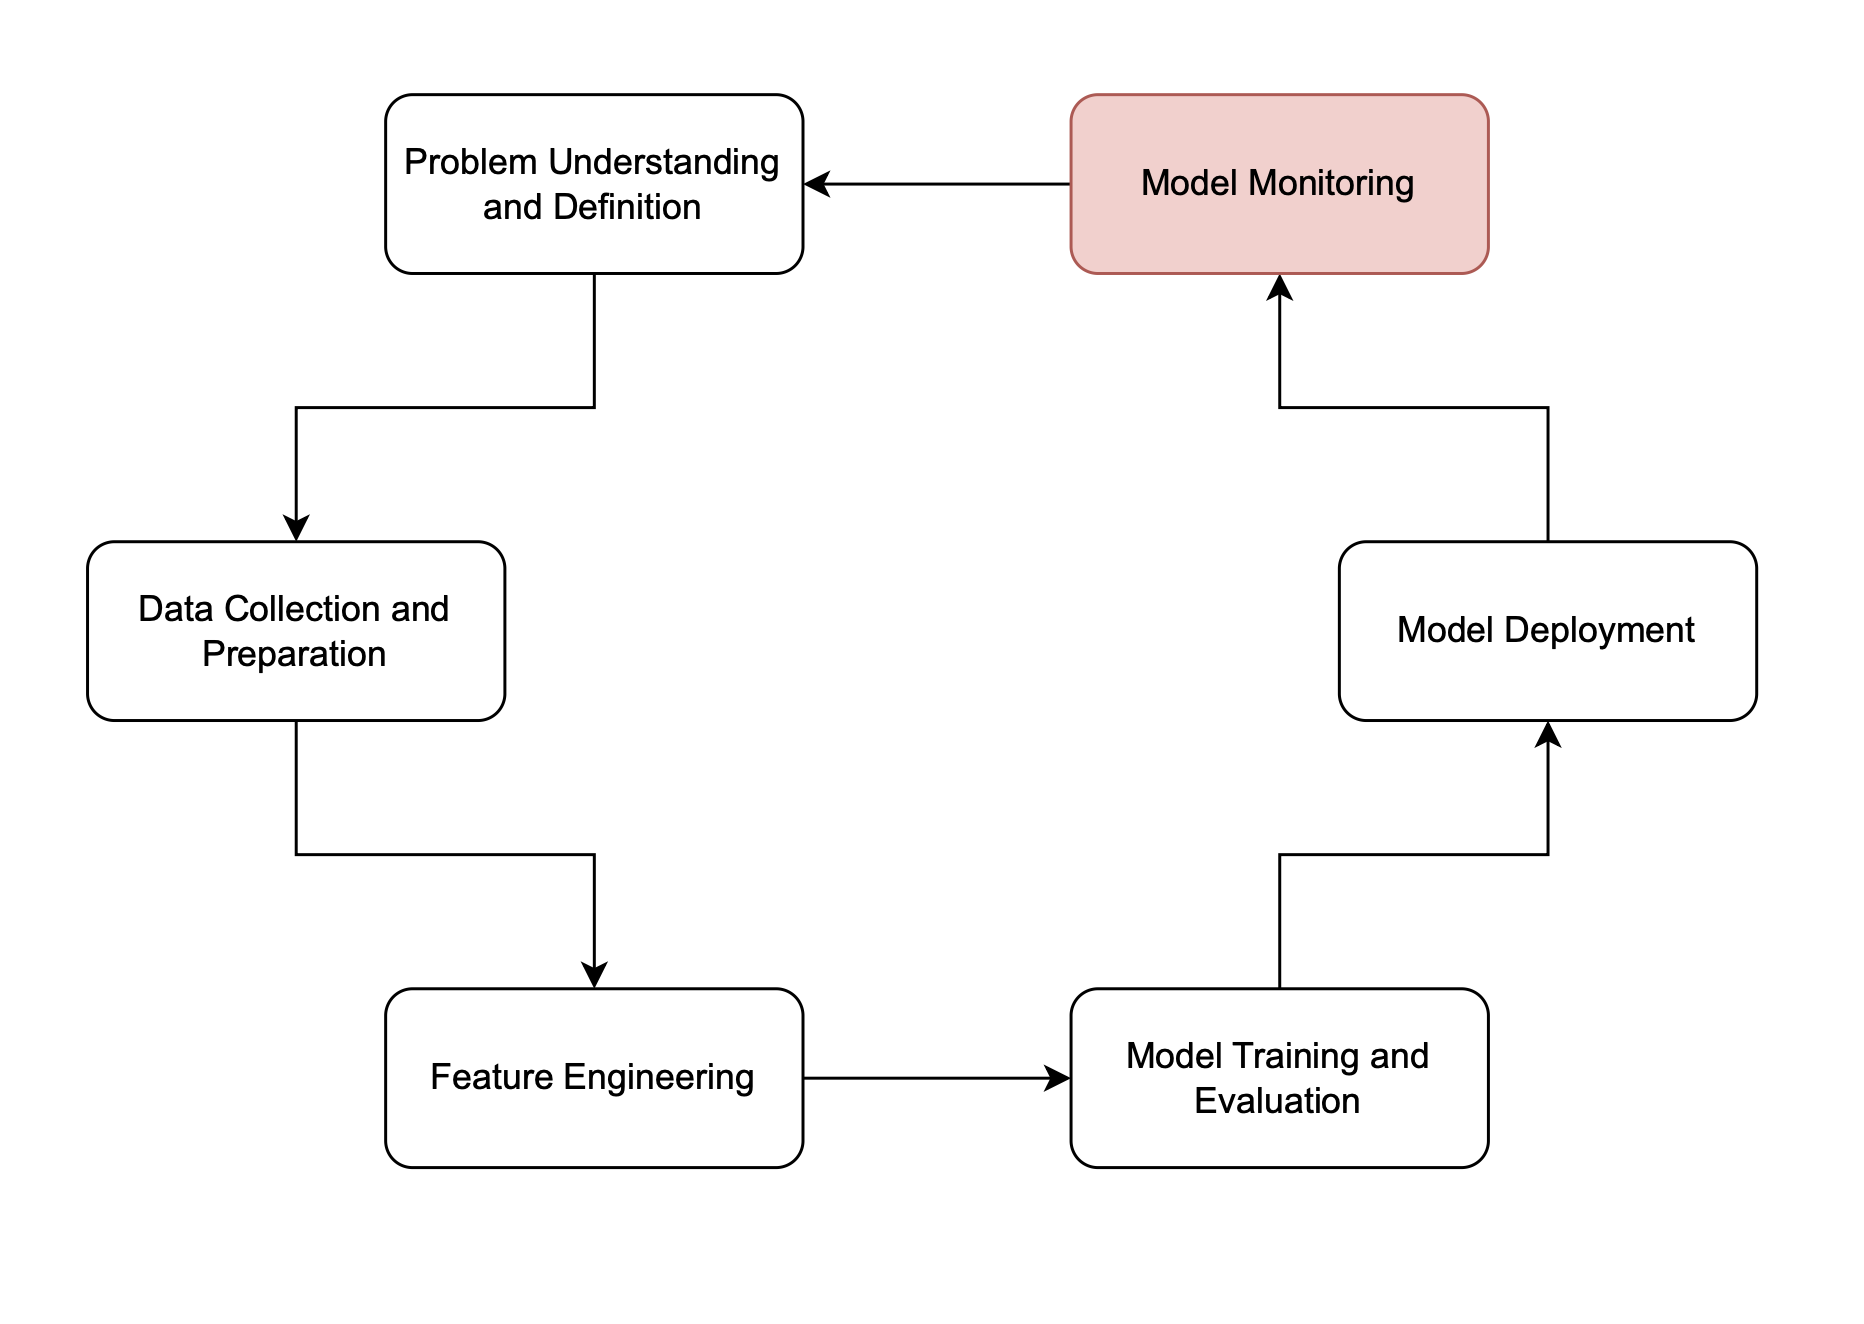
  • 訓練、最佳化、部署、預測……接下來呢?
  • 監控
    • 紀錄日誌結果
    • 視覺化效能

機器學習生命週期中的監控階段

端到端機器學習

使用 Python 記錄日誌

import logging
import matplotlib.pyplot as plt

# Setting up basic logging configuration
logging.basicConfig(filename='predictions.log', level=logging.INFO)

# Make predictions on the test set and log the results
for i in range(X_test.shape[0]):
    instance = X_test[i,:].reshape(1, -1)
    prediction = model.predict(instance)
    logging.info(f'Inst. {i} - PredClass: {prediction[0]}, RealClass: {y_test[i]}')
端到端機器學習

使用 Python 記錄日誌(續)

# Function to visualize the predictions from log
with open(logfile, 'r') as f:
    lines = f.readlines()
    predicted_classes = [int(line.split("Predicted Class: ")[1].split(",")[0]) \
        for line in lines]

    # Perform data analysis, visualization, etc.
    ...
  • 用 Python 日誌追蹤模型效能
端到端機器學習

視覺化

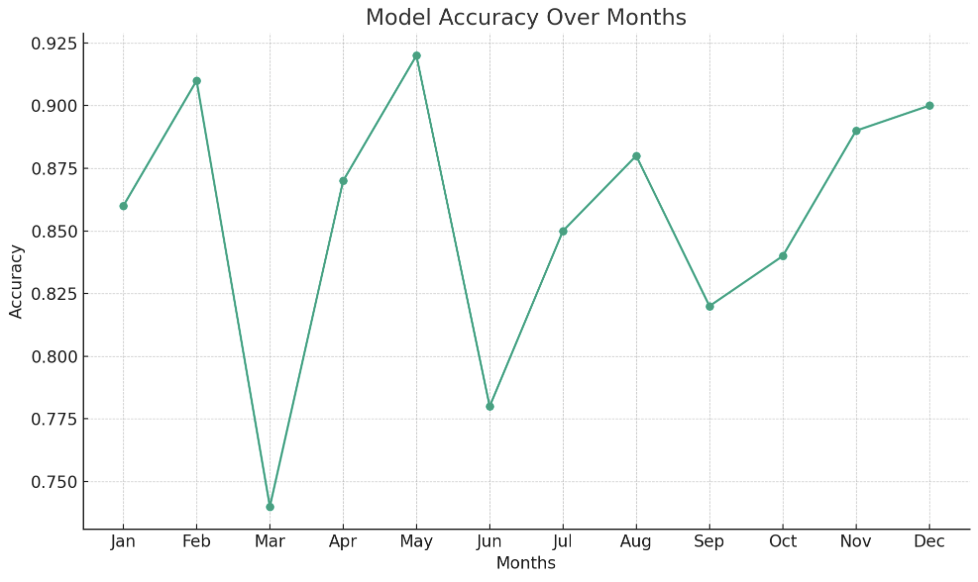
  • 檢視長期效能
  • 將輸入/預測的原始資料轉為洞見
import matplotlib.pyplot as plt

# Sample data: Random accuracy values for 12 months months = ["Jan", "Feb", "Mar", ...] accuracies = [0.86, 0.91, 0.74, ...]
plt.plot(months, accuracies, '-o') plt.title("Model Accuracy Over Months") plt.xlabel("Months") plt.ylabel("Accuracy") plt.show()
端到端機器學習

視覺化範例

折線圖:顯示 12 個月期間的假設模型準確率

端到端機器學習

日誌紀錄

  • 事件紀錄

    • 追蹤變數值、函式呼叫
    • 有助執行與效能的資訊
  • 監控可追蹤:

    • 使用量、效能、錯誤/異常
2023-08-04 09:15:20 [INFO] Model version 1.2.7 started

2023-08-04 09:15:45 [INFO] Preprocessing input data for prediction
2023-08-04 09:15:47 [DEBUG] Input data shape: (1, 12)
2023-08-04 09:15:48 [INFO] Making prediction
2023-08-04 09:15:50 [DEBUG] Output prediction: [0.78]
...
端到端機器學習

視覺化範例

  • 對模型有用的指標:長期的平衡準確率
  • 發現趨勢,檢查是否效能下滑
  • 判斷是否需要再訓練
  • 依情境選擇合適指標

範例:

  • 平衡準確率相對於預期、真實情境的變化
  • 可能顯示潛在問題
  • 選定並評估

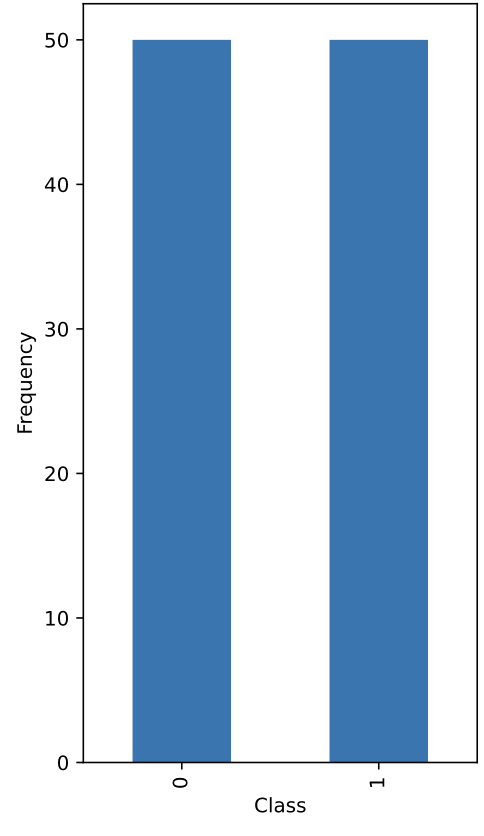
模型平衡準確率的視覺化

端到端機器學習

一起來練習吧!

端到端機器學習

Preparing Video For Download...